CFDs are complex instruments and come with a high risk of losing money rapidly due to leverage. 70% of retail investor accounts lose money when trading CFDs with this provider. You should consider whether you understand how CFDs work and whether you can afford to take the high risk of losing your money.
CFDs are complex instruments and come with a high risk of losing money rapidly due to leverage. 70.41% of retail investor accounts lose money when trading CFDs with this provider. You should consider whether you understand how CFDs work and whether you can afford to take the high risk of losing all your money. Read full risk warning.

USA500 Analysis

US Session Analysis for CFD Instruments 13/02/2025

Fundamental analysis

13 February, 2025

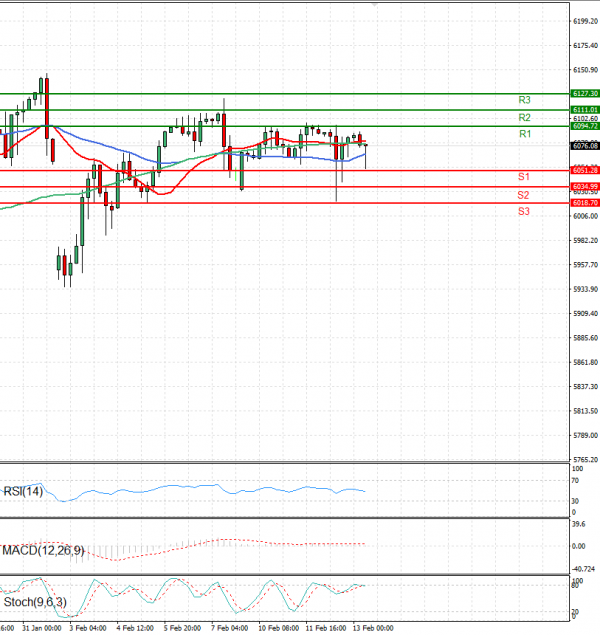
The USA500 is currently trading below 6,080 levels.

U.S. stock index futures traded largely flat Thursday as investors digested the possibility of a peace treaty between Russia and Ukraine, ahead of the release of more inflation data and a raft of earnings reports.

The S&P 500 Futures decreased 0.05%, the Dow Jones Futures was down 0.02% and the Nasdaq 100 Futures increased 0.10%.

Technical analysis

USA500 Analysis Technical analysis 13/02/2025
Time Frame: 1 hour

USA500 Support & Resistance Table - 13/02/2025

Support & Resistance Level Explanation
Resistance 2 6111.01 Daily R2
Resistance 1 6094.72 Daily R1
Support 1 6051.28 Daily S1
Support 2 6034.99 Daily S2

USA500 Indicator Table - 13/02/2025

Indicator Signal
SMA 20 Sell
SMA 50 Buy
SMA 100 Sell
MACD( 12;26;9) Neutral
RSI (14) Sell
Stochastic ( 9;6;3) Sell

USA500 Indicator / Period Table - 13/02/2025

Indicator / Period Day - SellWeek - BuyMonth - Buy
MACD( 12;26;9) Neutral BuyBuy
RSI (14) Sell BuyBuy
SMA 20 Sell BuyBuy

USA500 13/02/2025 - Reference Price : 6076.08

Sell
Simple Moving AverageBuy (1)Sell (2)
Technical Indicators - OscillatorsBuy (0)Sell (2)
Share It With Your Network
USA500 Chart
Update Time: -
Highest
Lowest
1M 5M H D W
Prices are loading..
Ready for trading?Start Now