Fortrade Canada Ltd. as an order-execution only dealer is not permitted to provide you with any advice or recommendations. These Market Commentaries should not be construed as a recommendation, advice or any attempt by Fortrade Canada Ltd. to prompt or influence you in making an investment decision to purchase, sell, hold or exchange any security or to influence the timing of such activity. This content is produced by Fortrade Limited which is not registered in any capacity with any securities regulatory authority in Canada.
70% of retail investor accounts lose money when trading CFDs with this provider.
CFDs are complex instruments and come with a high risk of losing money rapidly due to leverage. 70% of retail investor accounts lose money when trading CFDs with this provider. You should consider whether you understand how CFDs work and whether you can afford to take the high risk of losing your money.
67.52% of retail investor accounts lose money when trading CFDs with this provider.
CFDs are complex instruments and come with a high risk of losing money rapidly due to leverage. 67.52% of retail investor accounts lose money when trading CFDs with this provider. You should consider whether you understand how CFDs work and whether you can afford to take the high risk of losing all your money. Read full risk warning.
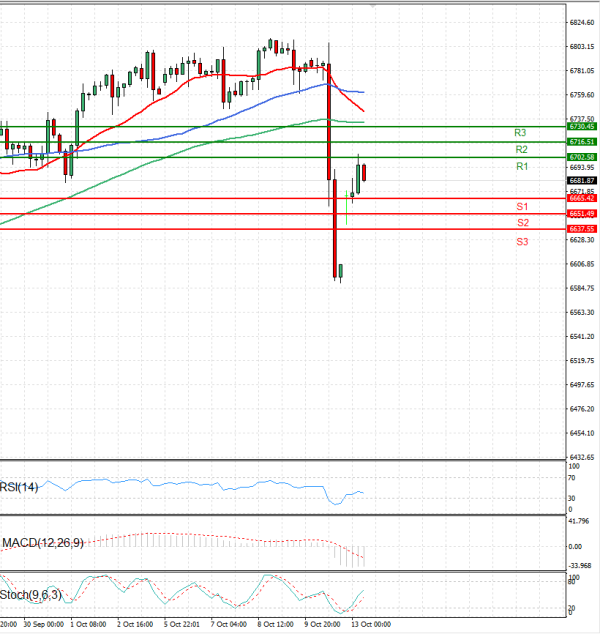
US Session Analysis for CFD Instruments 13/10/2025
Fundamental analysis
13 October, 2025
The USA500 is currently trading above 6,680 levels.
US stock futures climbed on Monday after President Donald Trump suggested he may scale back his threat to impose steep new tariffs on China, saying in a Truth Social post that trade relations with Beijing “will all be fine.” The comments followed Friday’s sharp selloff, when Trump’s warning of a “massive” tariff hike triggered a broad market decline after Beijing announced new export controls on rare earths vital to semiconductor and electric vehicle production.
S&P 500 Futures climbed 1.36%, Dow Jones Futures rose 0.97% and Nasdaq 100 Futures increased 1.90%.