The USA500 is currently trading below 7,000 levels.
US stock futures fell on Monday after President Donald Trump threatened new tariffs on eight European countries to force the “complete and total purchase of Greenland.” The proposed measures target Germany, the UK, France, Denmark, Norway, Sweden, the Netherlands and Finland, with a 10% tariff set to take effect on Feb. 1 and rise to 25% in June unless an agreement is reached.
S&P 500 Futures fell 1.04%, Dow Jones Futures fell 0.84% and Nasdaq 100 Futures increased 1.46%.
USA500 Analysis
US Session Analysis for CFD Instruments 19/01/2026
Technical analysis
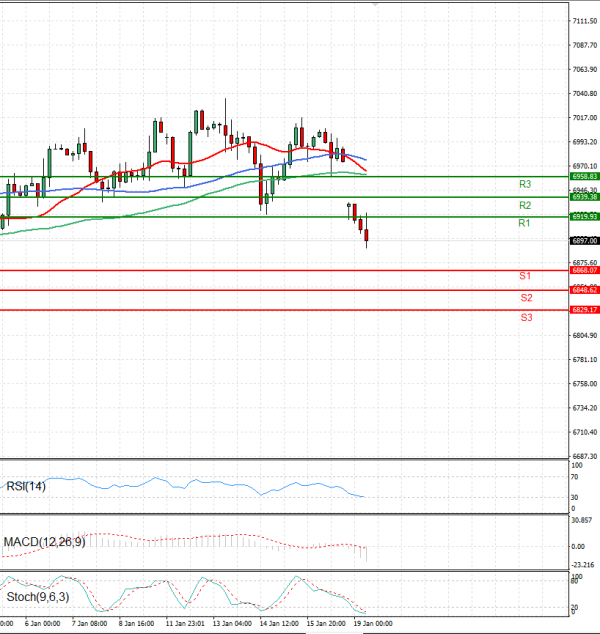
Time Frame: 1 hour
USA500 Support & Resistance Table - 19/01/2026
| Support & Resistance | Level | Explanation |
| Resistance 2 | 6939.38 | Daily R2 |
| Resistance 1 | 6919.93 | Daily R1 |
| Support 1 | 6868.07 | Daily S1 |
| Support 2 | 6848.62 | Daily S2 |
USA500 Indicator Table - 19/01/2026
| Indicator | Signal |
| SMA 20 | Sell |
| SMA 50 | Sell |
| SMA 100 | Sell |
| MACD( 12;26;9) | Sell |
| RSI (14) | Sell |
| Stochastic ( 9;6;3) | Sell |
USA500 Indicator / Period Table - 19/01/2026
| Indicator / Period | Day - Sell | Week - Buy | Month - Buy |
| MACD( 12;26;9) | Sell | Buy | Buy |
| RSI (14) | Sell | Buy | Buy |
| SMA 20 | Sell | Buy | Buy |
USA500 19/01/2026 - Reference Price : 6897.00
| Sell |
|
Ready for trading?Start Now