Fortrade Canada Ltd. as an order-execution only dealer is not permitted to provide you with any advice or recommendations. These Market Commentaries should not be construed as a recommendation, advice or any attempt by Fortrade Canada Ltd. to prompt or influence you in making an investment decision to purchase, sell, hold or exchange any security or to influence the timing of such activity. This content is produced by Fortrade Limited which is not registered in any capacity with any securities regulatory authority in Canada.
69% of retail investor accounts lose money when trading CFDs with this provider.
CFDs are complex instruments and come with a high risk of losing money rapidly due to leverage. 69% of retail investor accounts lose money when trading CFDs with this provider. You should consider whether you understand how CFDs work and whether you can afford to take the high risk of losing your money.
70.88% of retail investor accounts lose money when trading CFDs with this provider.
CFDs are complex instruments and come with a high risk of losing money rapidly due to leverage. 70.88% of retail investor accounts lose money when trading CFDs with this provider. You should consider whether you understand how CFDs work and whether you can afford to take the high risk of losing all your money. Read full risk warning.
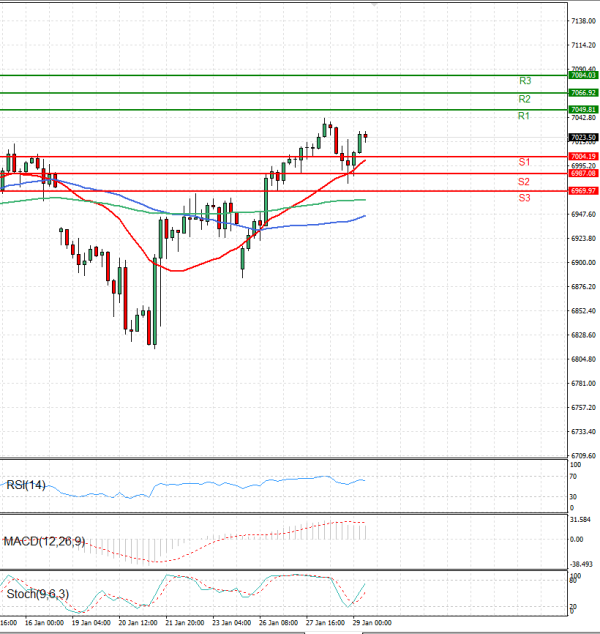
US Session Analysis for CFD Instruments 29/01/2026
Fundamental analysis
29 January, 2026
The USA500 is currently trading above 7,020 levels.
US stock futures rose on Thursday as investors digested earnings from tech firms alongside a widely expected decision by the Fed to hold rates steady. In after-hours trading, Meta Platforms surged nearly 8% after delivering a strong Q1 sales outlook, while Tesla added about 2% on better-than-expected Q4 results. By contrast, Microsoft slid 7% after reporting slowing cloud growth and issuing softer operating margin guidance for the current quarter. Market participants now turn their attention to upcoming earnings from Apple later today.
S&P 500 futures increased 0.32%, Dow Jones futures rose 0.19%, and Nasdaq 100 futures climbed 0.36%.