Fortrade Canada Ltd. as an order-execution only dealer is not permitted to provide you with any advice or recommendations. These Market Commentaries should not be construed as a recommendation, advice or any attempt by Fortrade Canada Ltd. to prompt or influence you in making an investment decision to purchase, sell, hold or exchange any security or to influence the timing of such activity. This content is produced by Fortrade Limited which is not registered in any capacity with any securities regulatory authority in Canada.
69% of retail investor accounts lose money when trading CFDs with this provider.
CFDs are complex instruments and come with a high risk of losing money rapidly due to leverage. 69% of retail investor accounts lose money when trading CFDs with this provider. You should consider whether you understand how CFDs work and whether you can afford to take the high risk of losing your money.
67.52% of retail investor accounts lose money when trading CFDs with this provider.
CFDs are complex instruments and come with a high risk of losing money rapidly due to leverage. 67.52% of retail investor accounts lose money when trading CFDs with this provider. You should consider whether you understand how CFDs work and whether you can afford to take the high risk of losing all your money. Read full risk warning.
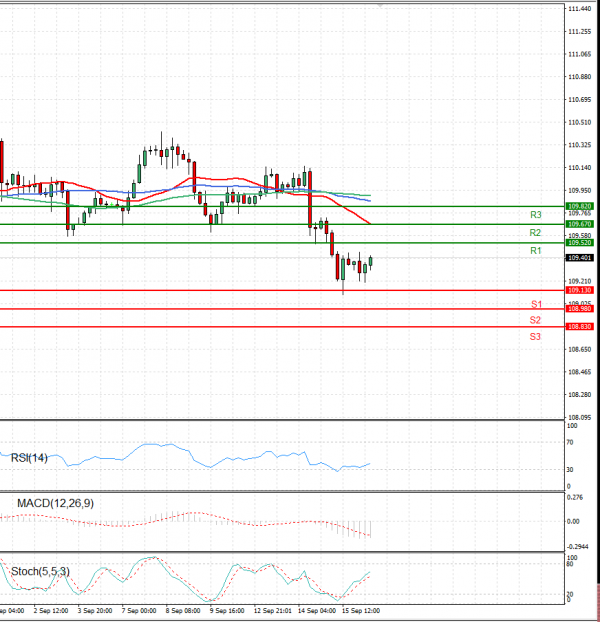
US Session Analysis for CFD Instruments 16/09/2021
Fundamental analysis
16 September, 2021
The USD/JPY pair moved sideways in choppy trading on Thursday. It is 109.323 at midday in Europe. Japan’s Exports for August rose 26.2%, Year-over-Year, well below the 34.0% that had been forecast. Its Imports for August increased 44.7%, Year-over-Year, higher than analysts expected. Taken together Japan’s Trade Balance for August came in at -635.4 billion yen, much worse than the consensus forecast of -47.7 billion yen. The United States will report Initial Jobless Claims for the past week and the Philadelphia Fed Manufacturing Index for September later today.