Fortrade Canada Ltd. as an order-execution only dealer is not permitted to provide you with any advice or recommendations. These Market Commentaries should not be construed as a recommendation, advice or any attempt by Fortrade Canada Ltd. to prompt or influence you in making an investment decision to purchase, sell, hold or exchange any security or to influence the timing of such activity. This content is produced by Fortrade Limited which is not registered in any capacity with any securities regulatory authority in Canada.
71% of retail investor accounts lose money when trading CFDs with this provider.
CFDs are complex instruments and come with a high risk of losing money rapidly due to leverage. 71% of retail investor accounts lose money when trading CFDs with this provider. You should consider whether you understand how CFDs work and whether you can afford to take the high risk of losing your money.
70.91% of retail investor accounts lose money when trading CFDs with this provider.
CFDs are complex instruments and come with a high risk of losing money rapidly due to leverage. 70.91% of retail investor accounts lose money when trading CFDs with this provider. You should consider whether you understand how CFDs work and whether you can afford to take the high risk of losing all your money. Read full risk warning.
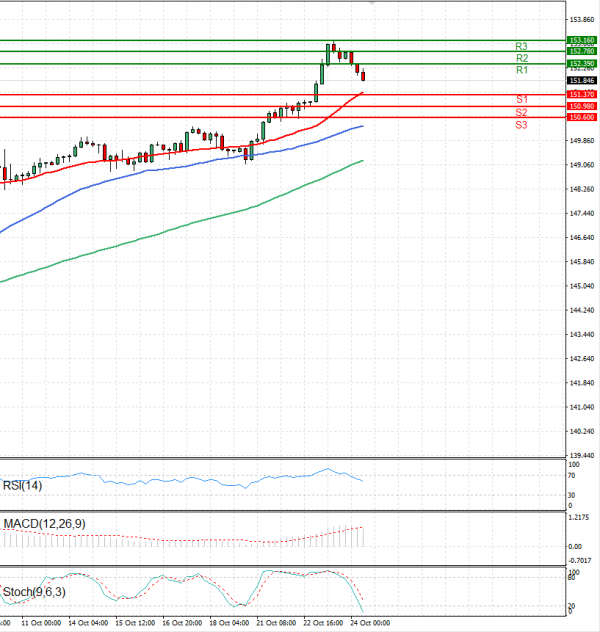
US Session Analysis for CFD Instruments 24/10/2024
Fundamental analysis
24 October, 2024
The US Dollar fell against the Japanese Yen in European trading above 152.00 levels.
The pair traded sharply lower in the European session after the greenback pulled back from yesterday’s fresh more than two month peak. In Japan Services PMI data was 49.3 vs 49.9 expected. In the United States, Initial Jobless Claims figures (243k exp) will be revealed (13:30 GMT+1), Global Manufacturing and Services PMI data for October (47.5 and 55.0 respectively expected) will be posted (14:45 GMT+1) and New Homes Sales for September data will be released (15:00 GMT+1).