Fortrade Canada Ltd. as an order-execution only dealer is not permitted to provide you with any advice or recommendations. These Market Commentaries should not be construed as a recommendation, advice or any attempt by Fortrade Canada Ltd. to prompt or influence you in making an investment decision to purchase, sell, hold or exchange any security or to influence the timing of such activity. This content is produced by Fortrade Limited which is not registered in any capacity with any securities regulatory authority in Canada.
71% of retail investor accounts lose money when trading CFDs with this provider.
CFDs are complex instruments and come with a high risk of losing money rapidly due to leverage. 71% of retail investor accounts lose money when trading CFDs with this provider. You should consider whether you understand how CFDs work and whether you can afford to take the high risk of losing your money.
70.41% of retail investor accounts lose money when trading CFDs with this provider.
CFDs are complex instruments and come with a high risk of losing money rapidly due to leverage. 70.41% of retail investor accounts lose money when trading CFDs with this provider. You should consider whether you understand how CFDs work and whether you can afford to take the high risk of losing all your money. Read full risk warning.
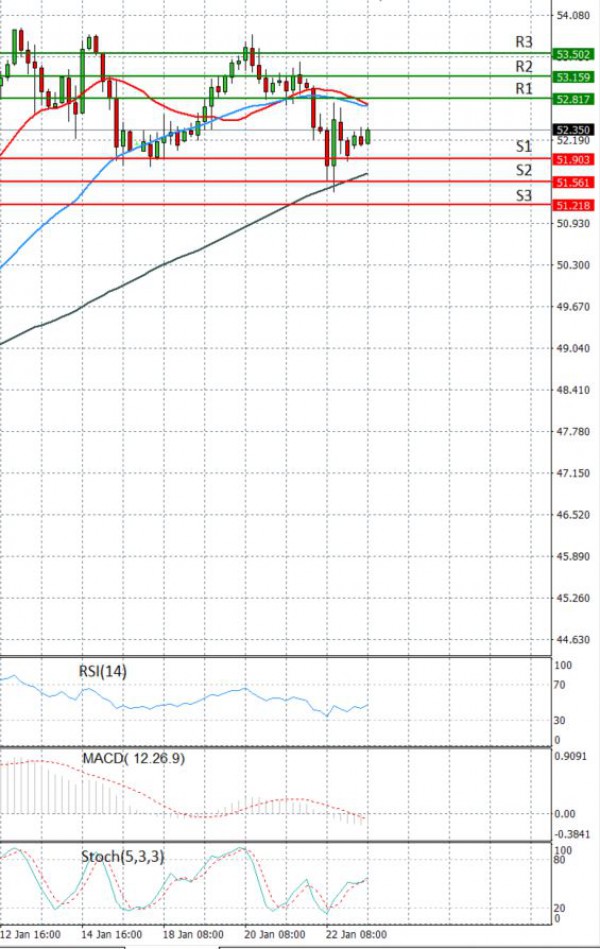
EU Session Analysis for CFD Instruments 25/01/2021
Fundamental analysis
25 January, 2021
Oil prices slipped for a second straight session on Monday as renewed COVID-19 lockdowns raised fresh concerns about global fuel demand. China reported a climb in new COVID-19 cases on Monday, casting a pall over demand prospects in the world’s largest energy consumer, the main pillar of strength for global oil consumption. Last Friday prices came under further pressure after data from the U.S. Energy Information Administration showed U.S. crude inventories surprisingly rose by 4.4 million barrels in the week to Jan. 15, versus expectations for a draw of 1.2 million barrels. The number of oil and natural gas rigs added by U.S. energy firms rose for a ninth week in a row in the week to Jan. 22. Some support for prices has come in recent weeks from additional production cuts from the world’s top exporter, Saudi Arabia. But investors are watching for a resumption of talks between the United States and Iran on a nuclear accord - which could see Washington lifting sanctions on Tehran’s oil exports, boosting supply.