CFDs are complex instruments and come with a high risk of losing money rapidly due to leverage. 71% of retail investor accounts lose money when trading CFDs with this provider. You should consider whether you understand how CFDs work and whether you can afford to take the high risk of losing your money.
CFDs are complex instruments and come with a high risk of losing money rapidly due to leverage. 70.91% of retail investor accounts lose money when trading CFDs with this provider. You should consider whether you understand how CFDs work and whether you can afford to take the high risk of losing all your money. Read full risk warning.

Crude Oil Analysis

EU Session Analysis for CFD Instruments 25/03/2021

Fundamental analysis

25 March, 2021

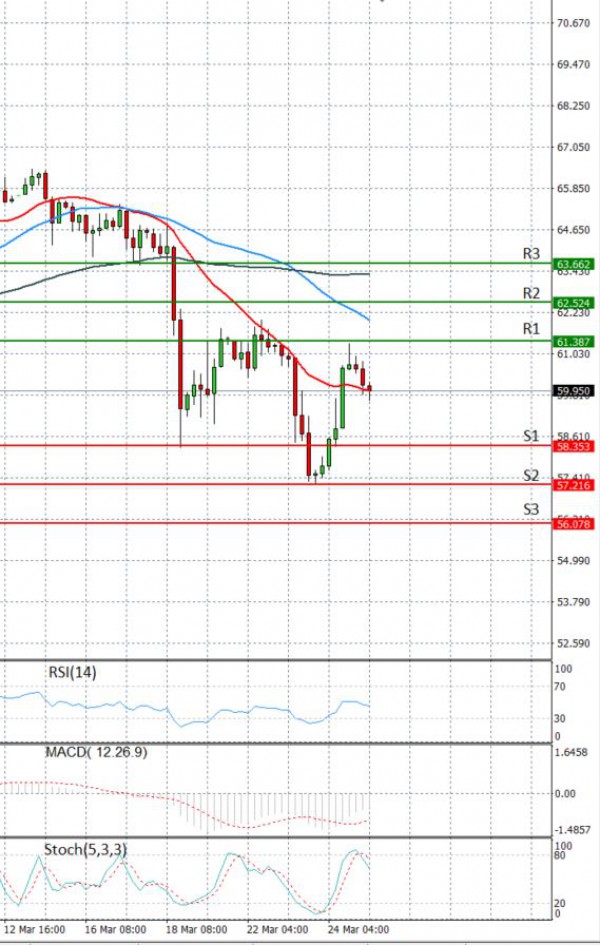
Oil prices fell more than 1% as fresh coronavirus lockdowns revived worries about demand for oil products, even as tug boats struggled to move a stranded container ship blocking crude oil carriers in the Suez Canal. Prices, which tumbled earlier in the week on worries about tighter pandemic curbs in Europe and vaccine delays stalling fuel demand growth, sharply reversed on Wednesday on news of the grounding in the Suez Canal, potentially blocking 10 tankers carrying 13 million barrels of oil. Dozens of ships were in the five waiting zones for passage through the nearly 200 km (120 mile) canal, with more approaching the area. India on Wednesday reported its highest one-day tally of new infections and deaths and said a new “double mutant” variant of the coronavirus had been found. Given the persistent demand worries and falling prices, expectations are growing that the Organization of the Petroleum Exporting Countries and allies, together called OPEC+, will roll over their current supply curbs into May at a meeting scheduled for April 1, four OPEC+ sources told Reuters.

Technical analysis

Crude Oil Analysis Technical analysis 25/03/2021
Time Frame: 1 hour

CRUDEOIL Support & Resistance Table - 25/03/2021

Support & Resistance Level Explanation
Resistance 2 62.524 Daily R2
Resistance 1 61.387 Daily R1
Support 1 58.353 Daily S1
Support 2 57.216 Daily S2

CRUDEOIL Indicator Table - 25/03/2021

Indicator Signal
SMA 20 Neutral
SMA 50 Sell
SMA 100 Sell
MACD( 12;26;9) Neutral
RSI (14) Sell
Stochastic ( 9;6;3) Buy

CRUDEOIL Indicator / Period Table - 25/03/2021

Indicator / Period Day - SellWeek - SellMonth - Buy
MACD( 12;26;9) Sell BuyBuy
RSI (14) Neutral SellBuy
SMA 20 Neutral SellBuy

CRUDEOIL 25/03/2021 - Reference Price : 59.870

Sell
Simple Moving AverageBuy (0)Sell (2)
Technical Indicators - OscillatorsBuy (1)Sell (1)
Share It With Your Network
Crude OIL Chart
Update Time: -
Highest
Lowest
1M 5M H D W
Prices are loading..
Ready for trading?Start Now