Fortrade Canada Ltd. as an order-execution only dealer is not permitted to provide you with any advice or recommendations. These Market Commentaries should not be construed as a recommendation, advice or any attempt by Fortrade Canada Ltd. to prompt or influence you in making an investment decision to purchase, sell, hold or exchange any security or to influence the timing of such activity. This content is produced by Fortrade Limited which is not registered in any capacity with any securities regulatory authority in Canada.
71% of retail investor accounts lose money when trading CFDs with this provider.
CFDs are complex instruments and come with a high risk of losing money rapidly due to leverage. 71% of retail investor accounts lose money when trading CFDs with this provider. You should consider whether you understand how CFDs work and whether you can afford to take the high risk of losing your money.
70.91% of retail investor accounts lose money when trading CFDs with this provider.
CFDs are complex instruments and come with a high risk of losing money rapidly due to leverage. 70.91% of retail investor accounts lose money when trading CFDs with this provider. You should consider whether you understand how CFDs work and whether you can afford to take the high risk of losing all your money. Read full risk warning.
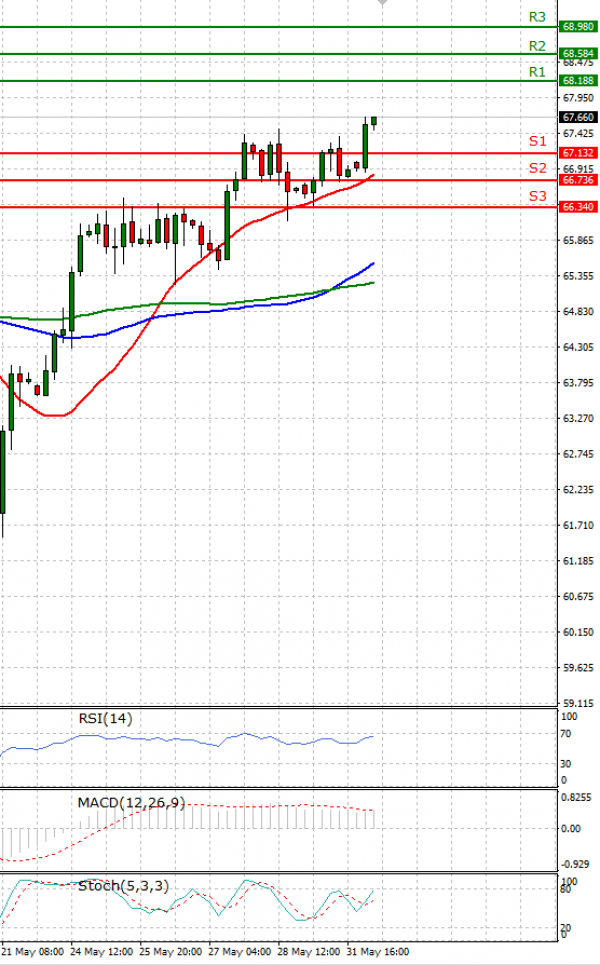
EU Session Analysis for CFD Instruments 01/06/2021
Fundamental analysis
01 June, 2021
Oil prices rose on Tuesday, as optimism grew over the fuel demand outlook during the summer driving season of the United States, the world's top oil consumer. Prices were also boosted after data from China showed that factory activity expanded at its fastest this year in May. Tracking firm GasBuddy said Sunday's U.S. gasoline demand jumped 9.6% above the average of the previous four Sundays, the highest Sunday demand since the summer of 2019. The Organization of the Petroleum Exporting Countries and its allies - known as OPEC+ - are likely to agree to continue to slowly ease supply curbs at a meeting on Tuesday, OPEC sources said, as producers balance an expected recovery in demand against a possible increase in Iranian output. OPEC+ decided in April to return 2.1 million barrels per day (bpd) of supply to the market from May to July, as it anticipated global demand would rise despite surging coronavirus cases in India, the world's third-largest oil consumer.