CFDs are complex instruments and come with a high risk of losing money rapidly due to leverage. 71% of retail investor accounts lose money when trading CFDs with this provider. You should consider whether you understand how CFDs work and whether you can afford to take the high risk of losing your money.
CFDs are complex instruments and come with a high risk of losing money rapidly due to leverage. 70.41% of retail investor accounts lose money when trading CFDs with this provider. You should consider whether you understand how CFDs work and whether you can afford to take the high risk of losing all your money. Read full risk warning.

Crude Oil Analysis

EU Session Analysis for CFD Instruments 30/06/2021

Fundamental analysis

30 June, 2021

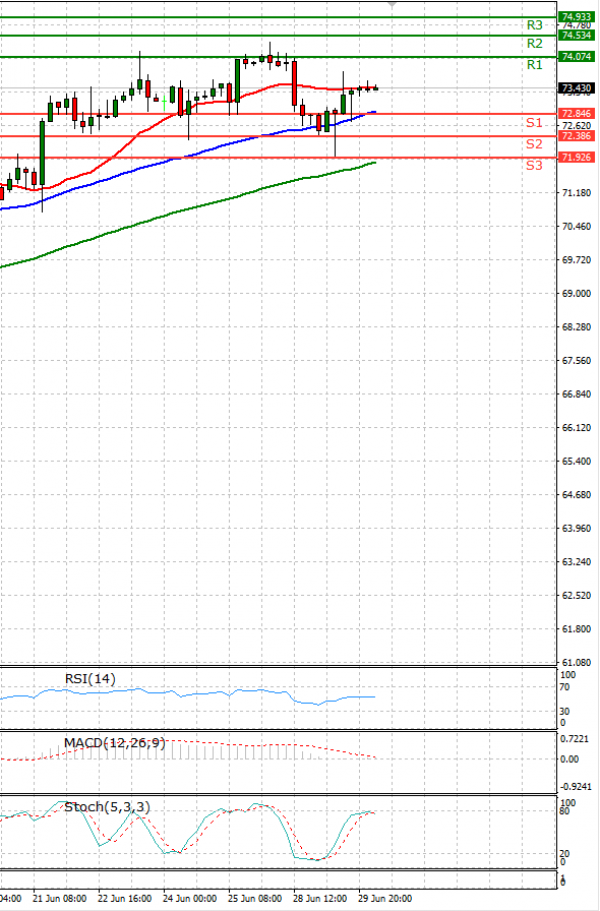
Oil prices on Wednesday extended the previous day’s small gains after an industry report showed U.S. crude stockpiles fell last week, overriding trader and investor concerns about transportation curbs in some countries as COVID-19 cases surge. While the highly contagious Delta variant of the coronavirus is taking hold in many countries, prompting new lockdowns or movement restrictions from Australia to Portugal, hopes of a broader recovery in demand for fuel remained intact. Crude stocks in the United States were down by 8.2 million barrels, American Petroleum Institute data showed, according to two sources, who spoke on condition of anonymity. But hopes for a broad recovery received a boost from Mohammad Barkindo, Secretary General of the Organization of the Petroleum Exporting Countries (OPEC), who said on Tuesday that demand is expected to rise by 6 million barrels per day (bpd) in 2021, with 5 million bpd of that coming in the second half of the year.

Technical analysis

Crude Oil Analysis Technical analysis 30/06/2021
Time Frame: 1 hour

CRUDEOIL Support & Resistance Table - 30/06/2021

Support & Resistance Level Explanation
Resistance 2 74.534 Daily R2
Resistance 1 74.074 Daily R1
Support 1 72.846 Daily S1
Support 2 72.386 Daily S2

CRUDEOIL Indicator Table - 30/06/2021

Indicator Signal
SMA 20 Neutral
SMA 50 Buy
SMA 100 Buy
MACD( 12;26;9) Buy
RSI (14) Buy
Stochastic ( 9;6;3) Buy

CRUDEOIL Indicator / Period Table - 30/06/2021

Indicator / Period Day - BuyWeek - BuyMonth - Buy
MACD( 12;26;9) Buy BuyBuy
RSI (14) Buy BuyBuy
SMA 20 Neutral BuyBuy

CRUDEOIL 30/06/2021 - Reference Price : 73.460

Buy
Simple Moving AverageBuy (2)Sell (0)
Technical Indicators - OscillatorsBuy (2)Sell (0)
Share It With Your Network
Crude OIL Chart
Update Time: -
Highest
Lowest
1M 5M H D W
Prices are loading..
Ready for trading?Start Now