Oil prices fell on Wednesday after an industry report showed an unexpected build-up in U.S. oil inventories last week, which heightened worries about a resurgence in COVID-19 infections potentially dampening fuel demand. U.S. crude stocks rose by 806,000 barrels for the week that ended July 16, according to two market sources, citing American Petroleum Institute figures. By comparison, 10 analysts polled by Reuters had estimated, on average, that crude stocks fell by about 4.5 million barrels. Investors are awaiting data from the U.S. Energy Information Administration to see whether it confirms there was an increase in crude inventories, which would end an eight-week streak of inventory drawdowns.
Crude Oil Analysis
EU Session Analysis for CFD Instruments 21/07/2021
Technical analysis
Time Frame: 1 hour
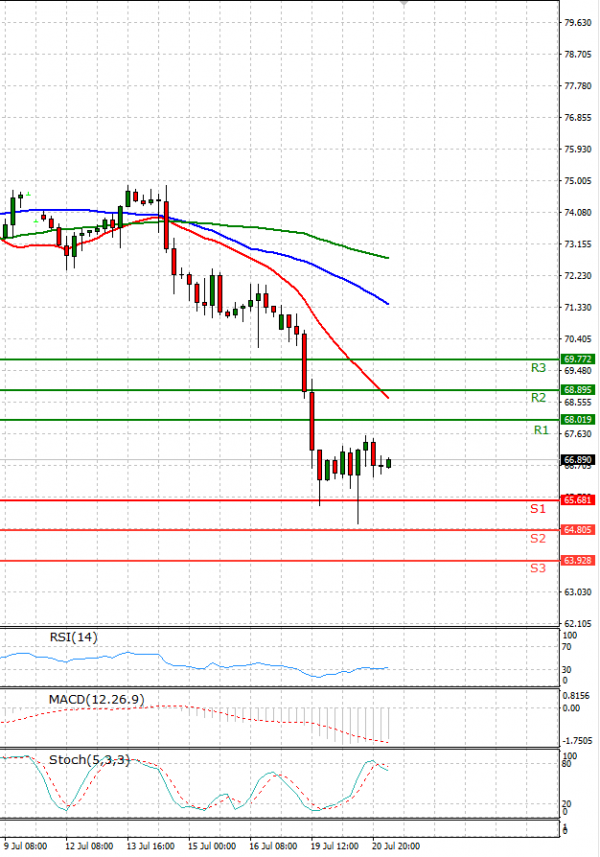
CRUDEOIL Support & Resistance Table - 21/07/2021
| Support & Resistance | Level | Explanation |
| Resistance 2 | 68.895 | Daily R2 |
| Resistance 1 | 68.019 | Daily R1 |
| Support 1 | 65.681 | Daily S1 |
| Support 2 | 64.805 | Daily S2 |
CRUDEOIL Indicator Table - 21/07/2021
| Indicator | Signal |
| SMA 20 | Sell |
| SMA 50 | Sell |
| SMA 100 | Sell |
| MACD( 12;26;9) | Sell |
| RSI (14) | Sell |
| Stochastic ( 9;6;3) | Buy |
CRUDEOIL Indicator / Period Table - 21/07/2021
| Indicator / Period | Day - Sell | Week - Sell | Month - Buy |
| MACD( 12;26;9) | Sell | Buy | Buy |
| RSI (14) | Sell | Sell | Buy |
| SMA 20 | Sell | Sell | Neutral |
CRUDEOIL 21/07/2021 - Reference Price : 66.850
| Sell |
|
Ready for trading?Start Now