CFDs are complex instruments and come with a high risk of losing money rapidly due to leverage. 71% of retail investor accounts lose money when trading CFDs with this provider. You should consider whether you understand how CFDs work and whether you can afford to take the high risk of losing your money.
CFDs are complex instruments and come with a high risk of losing money rapidly due to leverage. 70.91% of retail investor accounts lose money when trading CFDs with this provider. You should consider whether you understand how CFDs work and whether you can afford to take the high risk of losing all your money. Read full risk warning.

Crude Oil Analysis

EU Session Analysis for CFD Instruments 12/01/2022

Fundamental analysis

12 January, 2022

Oil prices climbed on Wednesday, extending big gains in the previous session after the U.S. Federal Reserve chief signaled the central bank may raise rates more slowly than expected, which should support oil demand in the near term. Benchmarks Brent and WTI are trading at their highest levels since the contagious omicron variant of the coronavirus emerged in late November, as it has not hit fuel demand the way previous variants did. Data from the American Petroleum Institute (API) industry gave a weaker picture on fuel demand, with a smaller decline in crude stockpiles than expected and bigger builds than expected in gasoline and distillate inventories. Crude stocks fell by 1.1 million barrels for the week ended Jan. 7, according to market sources citing API figures. That was less than the 1.9 million barrel draw that 10 analysts polled by Reuters had expected. buoying the market was the U.S. Energy Information Administration’s upgraded oil demand outlook released on Tuesday, seeing total U.S. demand rising by 840,000 barrels per day in 2022 from last year, up from a previous forecast for an increase of 700,000 bpd. At the same time, the EIA pared its production outlook for 2022, expecting U.S. oil output to rise by 640,000 bpd, down from an earlier forecast for an increase of 670,000 bpd.
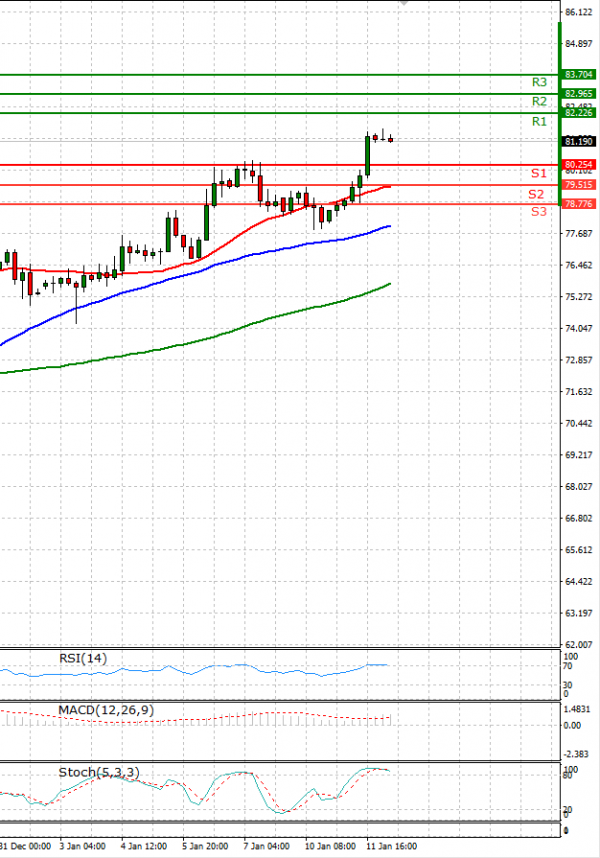
Technical analysis

Crude Oil Analysis Technical analysis 12/01/2022
Time Frame: 1 hour

CRUDEOIL Support & Resistance Table - 12/01/2022

Support & Resistance Level Explanation
Resistance 2 82.965 Daily R2
Resistance 1 82.226 Daily R1
Support 1 80.254 Daily S1
Support 2 79.515 Daily S2

CRUDEOIL Indicator Table - 12/01/2022

Indicator Signal
SMA 20 Buy
SMA 50 Buy
SMA 100 Buy
MACD( 12;26;9) Buy
RSI (14) Buy
Stochastic ( 9;6;3) Buy

CRUDEOIL Indicator / Period Table - 12/01/2022

Indicator / Period Day - BuyWeek - BuyMonth - Buy
MACD( 12;26;9) Buy BuyBuy
RSI (14) Buy BuyBuy
SMA 20 Buy BuyBuy

CRUDEOIL 12/01/2022 - Reference Price : 81.240

Buy
Simple Moving AverageBuy (3)Sell (0)
Technical Indicators - OscillatorsBuy (3)Sell (0)
Share It With Your Network
Crude OIL Chart
Update Time: -
Highest
Lowest
1M 5M H D W
Prices are loading..
Ready for trading?Start Now