CFDs are complex instruments and come with a high risk of losing money rapidly due to leverage. 70% of retail investor accounts lose money when trading CFDs with this provider. You should consider whether you understand how CFDs work and whether you can afford to take the high risk of losing your money.
CFDs are complex instruments and come with a high risk of losing money rapidly due to leverage. 67.52% of retail investor accounts lose money when trading CFDs with this provider. You should consider whether you understand how CFDs work and whether you can afford to take the high risk of losing all your money. Read full risk warning.

Crude Oil Analysis

EU Session Analysis for CFD Instruments 07/03/2022

Fundamental analysis

07 March, 2022

Oil prices soared more than 9% on Monday, touching their highest since 2008, as the United States and European allies mull a Russian oil import ban and delays in the potential return of Iranian crude to global markets fuelled tight supply fears. In the first few minutes of trade on Monday, both benchmarks spiked more than $10 a barrel to their highest since July 2008 with Brent at $139.13 and WTI at $130.50. The United States and European allies are exploring banning imports of Russian oil, Blinken said on Sunday, and the White House coordinated with key Congressional committees moving forward with their own ban. Analysts at Bank of America said if most of Russia's oil exports are cut off, there could be a 5 million barrel or larger shortfall, and that means oil prices could double from $100 to $200 a barrel, while JP Morgan analysts said this week oil could soar to $185 per barrel this year. Talks to revive Iran's 2015 nuclear deal with world powers were also mired in uncertainty on Sunday.
Technical analysis

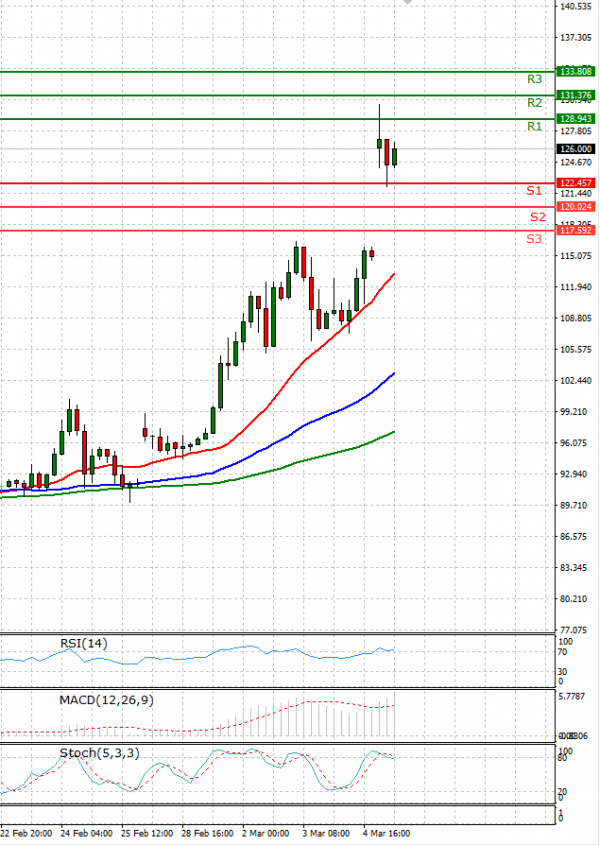
Crude Oil Analysis Technical analysis 07/03/2022
Time Frame: 1 hour

CRUDEOIL Support & Resistance Table - 07/03/2022

Support & Resistance Level Explanation
Resistance 2 131.376 Daily R2
Resistance 1 128.943 Daily R1
Support 1 122.457 Daily S1
Support 2 120.024 Daily S2

CRUDEOIL Indicator Table - 07/03/2022

Indicator Signal
SMA 20 Buy
SMA 50 Buy
SMA 100 Buy
MACD( 12;26;9) Buy
RSI (14) Buy
Stochastic ( 9;6;3) Buy

CRUDEOIL Indicator / Period Table - 07/03/2022

Indicator / Period Day - BuyWeek - BuyMonth - Buy
MACD( 12;26;9) Buy BuyBuy
RSI (14) Buy BuyBuy
SMA 20 Buy BuyBuy

CRUDEOIL 07/03/2022 - Reference Price : 125.700

Buy
Simple Moving AverageBuy (3)Sell (0)
Technical Indicators - OscillatorsBuy (3)Sell (0)
Share It With Your Network
Crude OIL Chart
Update Time: -
Highest
Lowest
1M 5M H D W
Prices are loading..
Ready for trading?Start Now