CFDs are complex instruments and come with a high risk of losing money rapidly due to leverage. 70% of retail investor accounts lose money when trading CFDs with this provider. You should consider whether you understand how CFDs work and whether you can afford to take the high risk of losing your money.
CFDs are complex instruments and come with a high risk of losing money rapidly due to leverage. 67.52% of retail investor accounts lose money when trading CFDs with this provider. You should consider whether you understand how CFDs work and whether you can afford to take the high risk of losing all your money. Read full risk warning.

Crude Oil Analysis

EU Session Analysis for CFD Instruments 01/06/2022

Fundamental analysis

01 June, 2022

Oil prices gained slightly on Wednesday after European Union leaders agreed to a partial and phased ban on Russian oil and as China ended its COVID-19 lockdown in Shanghai. Both benchmarks ended May higher, marking the sixth straight month of rising prices. EU leaders agreed in principle on Monday to cut 90% of oil imports from Russia by the end of this year, the bloc's toughest sanctions yet on Moscow since the invasion of Ukraine three months ago, which Moscow calls a "special military operation". Capping gains were reports that some producers were exploring the idea of suspending Russia's participation in a production deal of OPEC+, a grouping of Organization of the Petroleum Exporting Countries members and their allies, on expectations such a move would increase supply. Data from the U.S. government on stockpiles was expected on Thursday. Analysts, in a Reuters poll, expected U.S. crude oil inventories to fall last week, while gasoline and distillate stockpiles were seen up.
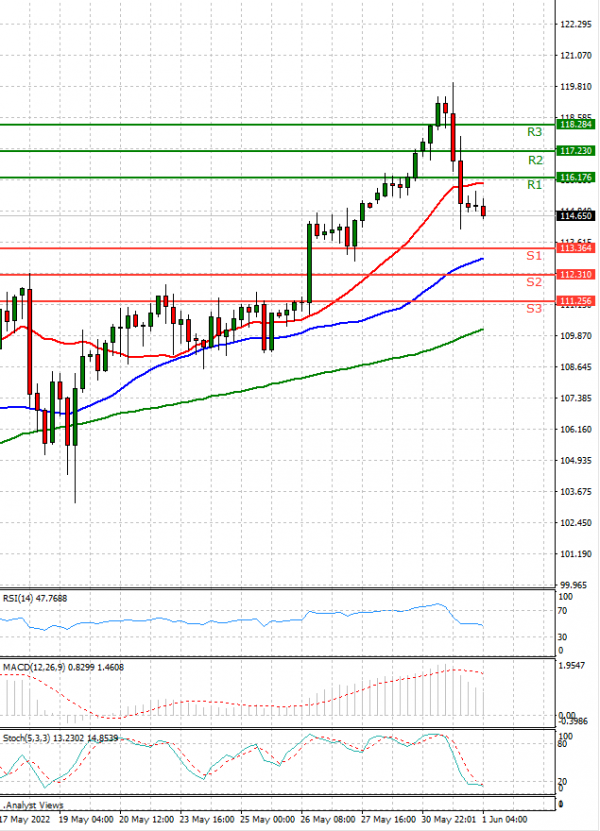
Technical analysis

Crude Oil Analysis Technical analysis 01/06/2022
Time Frame: 1 hour

CRUDEOIL Support & Resistance Table - 01/06/2022

Support & Resistance Level Explanation
Resistance 2 117.230 Daily R2
Resistance 1 116.176 Daily R1
Support 1 113.364 Daily S1
Support 2 112.310 Daily S2

CRUDEOIL Indicator Table - 01/06/2022

Indicator Signal
SMA 20 Sell
SMA 50 Buy
SMA 100 Buy
MACD( 12;26;9) Buy
RSI (14) Sell
Stochastic ( 9;6;3) Sell

CRUDEOIL Indicator / Period Table - 01/06/2022

Indicator / Period Day - SellWeek - BuyMonth - Buy
MACD( 12;26;9) Buy BuyBuy
RSI (14) Sell BuyBuy
SMA 20 Sell BuyBuy

CRUDEOIL 01/06/2022 - Reference Price : 114.770

Sell
Simple Moving AverageBuy (2)Sell (1)
Technical Indicators - OscillatorsBuy (1)Sell (2)
Share It With Your Network
Crude OIL Chart
Update Time: -
Highest
Lowest
1M 5M H D W
Prices are loading..
Ready for trading?Start Now