CFDs are complex instruments and come with a high risk of losing money rapidly due to leverage. 71% of retail investor accounts lose money when trading CFDs with this provider. You should consider whether you understand how CFDs work and whether you can afford to take the high risk of losing your money.
CFDs are complex instruments and come with a high risk of losing money rapidly due to leverage. 70.91% of retail investor accounts lose money when trading CFDs with this provider. You should consider whether you understand how CFDs work and whether you can afford to take the high risk of losing all your money. Read full risk warning.

Crude Oil Analysis

EU Session Analysis for CFD Instruments 21/06/2022

Fundamental analysis

21 June, 2022

Oil prices edged down on Monday, reversing earlier gains, as concerns about slowing global economic growth and fuel demand offset worries about tightening supplies. Oil from Russia, the world's second-largest exporter, remains out of reach to most countries because of Western sanctions over the war in Ukraine. The impact has been partly mitigated by the release of strategic petroleum reserves, led by the United States, and a ramp-up of production from the Organization of the Petroleum Exporting Countries (OPEC) and its allies, together known as OPEC+, although that is thinning the world's buffer against further supply disruption. In Libya, oil production remained volatile following blockades by groups in the country's east. The Libyan Oil Minister Mohamed Oun told Reuters on Monday that the country's total production is at about 700,000 barrels per day (bpd). Libya's output had fallen to 100,000 to 150,000 bpd, a spokesman for the oil ministry said last week. Oil products exports from China, once a major exporter, continued to decline, keeping global supplies tight. The country's gasoline exports in May fell 45.5% from a year earlier.
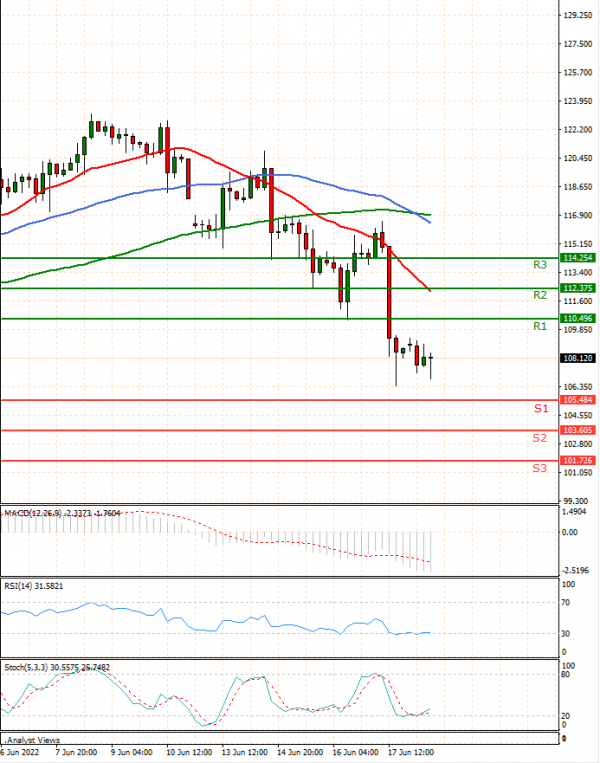
Technical analysis

Crude Oil Analysis Technical analysis 21/06/2022
Time Frame: 1 hour

CRUDEOIL Support & Resistance Table - 21/06/2022

Support & Resistance Level Explanation
Resistance 2 113.946 Daily R2
Resistance 1 112.208 Daily R1
Support 1 107.572 Daily S1
Support 2 105.834 Daily S2

CRUDEOIL Indicator Table - 21/06/2022

Indicator Signal
SMA 20 Sell
SMA 50 Sell
SMA 100 Sell
MACD( 12;26;9) Sell
RSI (14) Sell
Stochastic ( 9;6;3) Buy

CRUDEOIL Indicator / Period Table - 21/06/2022

Indicator / Period Day - SellWeek - SellMonth - Buy
MACD( 12;26;9) Sell BuyBuy
RSI (14) Sell SellBuy
SMA 20 Sell SellBuy

CRUDEOIL 21/06/2022 - Reference Price : 109.890

Sell
Simple Moving AverageBuy (0)Sell (3)
Technical Indicators - OscillatorsBuy (1)Sell (2)
Share It With Your Network
Crude OIL Chart
Update Time: -
Highest
Lowest
1M 5M H D W
Prices are loading..
Ready for trading?Start Now