CFDs are complex instruments and come with a high risk of losing money rapidly due to leverage. 71% of retail investor accounts lose money when trading CFDs with this provider. You should consider whether you understand how CFDs work and whether you can afford to take the high risk of losing your money.
CFDs are complex instruments and come with a high risk of losing money rapidly due to leverage. 70.91% of retail investor accounts lose money when trading CFDs with this provider. You should consider whether you understand how CFDs work and whether you can afford to take the high risk of losing all your money. Read full risk warning.

Crude Oil Analysis

EU Session Analysis for CFD Instruments 25/08/2022

Fundamental analysis

25 August, 2022

Oil prices rose on Thursday on mounting supply tightness concerns amid disruptions to Russian exports, the potential for major producers to cut output, and the partial shutdown of a U.S. refinery. Both crude oil benchmark contracts touched three-week highs on Wednesday after the Saudi energy minister flagged the possibility thatthe Organization of the Petroleum Exporting Countries and its allies, known as OPEC+, will cut production to support prices. Also, discussions on an agreement on Iran's nuclear programme remain stalled, calling into question any resumption of its exports, although talks are continuing. In the United States, the world's biggest oil consumer, BP reported shutting some units its Whiting, Indiana, refinery after an electrical fire on Wednesday. The 430,000 barrel-per-day plant is a key supplier of fuels to the central U.S. and the city of Chicago. Falling U.S. crude and product stockpiles also added to the upward pressure on prices. Oil inventories fell by 3.3 million barrels in the week to Aug. 19 at 421.7 million barrels, steeper from analysts' expectations in a Reuters poll for a 933,000-barrel drop.
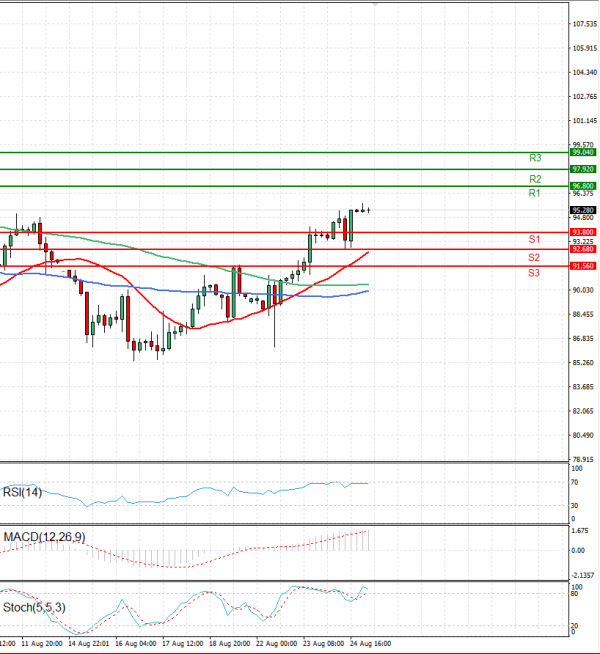
Technical analysis

Crude Oil Analysis Technical analysis 25/08/2022
Time Frame: 1 hour

CRUDEOIL Support & Resistance Table - 25/08/2022

Support & Resistance Level Explanation
Resistance 2 97.92 Daily R2
Resistance 1 96.80 Daily R1
Support 1 93.80 Daily S1
Support 2 92.68 Daily S2

CRUDEOIL Indicator Table - 25/08/2022

Indicator Signal
SMA 20 Buy
SMA 50 Buy
SMA 100 Buy
MACD( 12;26;9) Buy
RSI (14) Neutral
Stochastic ( 9;6;3) Sell

CRUDEOIL Indicator / Period Table - 25/08/2022

Indicator / Period Day - BuyWeek - SellMonth - Buy
MACD( 12;26;9) Buy SellBuy
RSI (14) Neutral NeutralBuy
SMA 20 Buy SellBuy

CRUDEOIL 25/08/2022 - Reference Price : 95.28

Buy
Simple Moving AverageBuy (3)Sell (0)
Technical Indicators - OscillatorsBuy (1)Sell (1)
Share It With Your Network
Crude OIL Chart
Update Time: -
Highest
Lowest
1M 5M H D W
Prices are loading..
Ready for trading?Start Now