Fortrade Canada Ltd. as an order-execution only dealer is not permitted to provide you with any advice or recommendations. These Market Commentaries should not be construed as a recommendation, advice or any attempt by Fortrade Canada Ltd. to prompt or influence you in making an investment decision to purchase, sell, hold or exchange any security or to influence the timing of such activity. This content is produced by Fortrade Limited which is not registered in any capacity with any securities regulatory authority in Canada.
70% of retail investor accounts lose money when trading CFDs with this provider.
CFDs are complex instruments and come with a high risk of losing money rapidly due to leverage. 70% of retail investor accounts lose money when trading CFDs with this provider. You should consider whether you understand how CFDs work and whether you can afford to take the high risk of losing your money.
70.41% of retail investor accounts lose money when trading CFDs with this provider.
CFDs are complex instruments and come with a high risk of losing money rapidly due to leverage. 70.41% of retail investor accounts lose money when trading CFDs with this provider. You should consider whether you understand how CFDs work and whether you can afford to take the high risk of losing all your money. Read full risk warning.
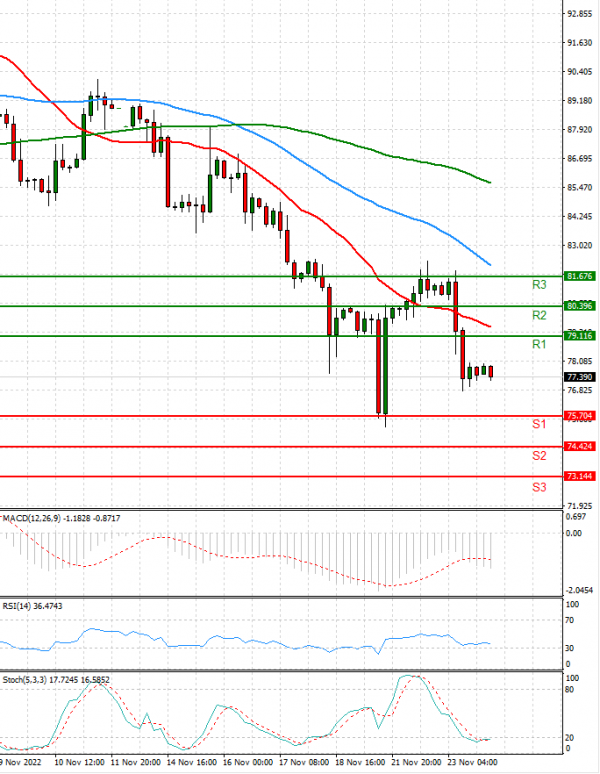
EU Session Analysis for CFD Instruments 24/11/2022
Fundamental analysis
24 November, 2022
Oil trickled down on Thursday, hovering around two-month lows, as the proposed price cap on Russian oil from Group of Seven (G7) nations was considered higher than the current trading levels, alleviating concerns over tight supply. A greater-than-expected build in U.S. gasoline inventories and widening COVID controls in China added to downward pressure. The G7 is looking at a cap on Russian seaborne oil at $65-$70 a barrel, according to a European official, though European Union governments have not yet agreed on a price. Oil prices also came under pressure after the Energy Information Administration (EIA) said on Wednesday that U.S. gasoline and distillate inventories had both risen substantially last week. The increase alleviated some concern about market tightness. But crude inventories fell by 3.7 million barrels in the week to Nov. 18 to 431.7 million barrels, compared with analysts' expectations in a Reuters poll for a 1.1 million-barrel drop.