Fortrade Canada Ltd. as an order-execution only dealer is not permitted to provide you with any advice or recommendations. These Market Commentaries should not be construed as a recommendation, advice or any attempt by Fortrade Canada Ltd. to prompt or influence you in making an investment decision to purchase, sell, hold or exchange any security or to influence the timing of such activity. This content is produced by Fortrade Limited which is not registered in any capacity with any securities regulatory authority in Canada.
71% of retail investor accounts lose money when trading CFDs with this provider.
CFDs are complex instruments and come with a high risk of losing money rapidly due to leverage. 71% of retail investor accounts lose money when trading CFDs with this provider. You should consider whether you understand how CFDs work and whether you can afford to take the high risk of losing your money.
70.41% of retail investor accounts lose money when trading CFDs with this provider.
CFDs are complex instruments and come with a high risk of losing money rapidly due to leverage. 70.41% of retail investor accounts lose money when trading CFDs with this provider. You should consider whether you understand how CFDs work and whether you can afford to take the high risk of losing all your money. Read full risk warning.
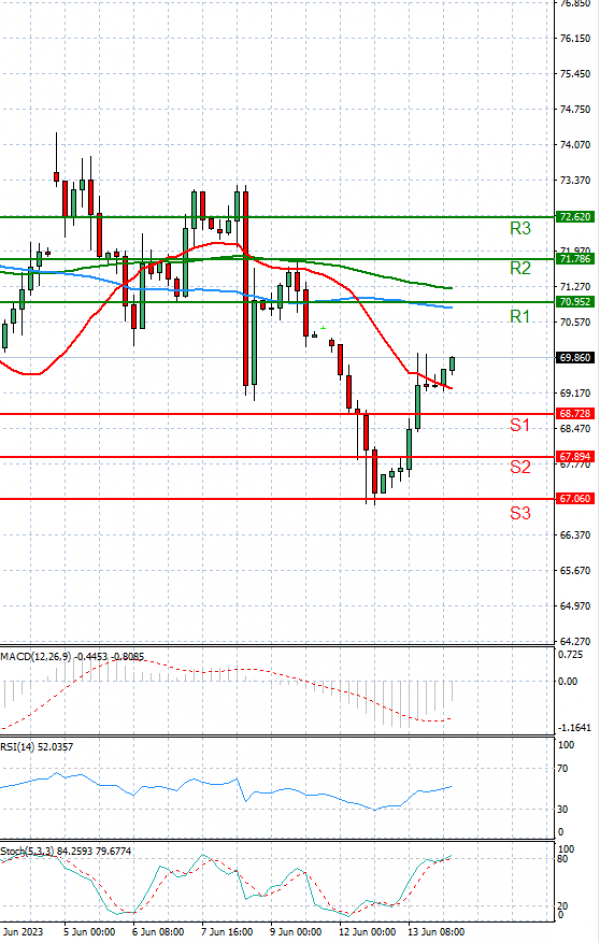
EU Session Analysis for CFD Instruments 14/06/2023
Fundamental analysis
14 June, 2023
Oil prices inched up slightly in Asian morning trade on Wednesday as investors awaited the outcome of the U.S. Federal Reserve's June meeting, key economic data from China and government data on U.S. crude stockpiles. Both benchmarks climbed more than 3% on Tuesday on hopes of rising fuel demand after China's central bank lowered a short-term lending rate. On the supply side, U.S. crude oil stocks rose by about 1 million barrels in the week ended June 9, according to market sources citing American Petroleum Institute figures, contrary to an average estimate for a 500,000 barrel decline from analysts polled by Reuters.