CFDs are complex instruments and come with a high risk of losing money rapidly due to leverage. 70% of retail investor accounts lose money when trading CFDs with this provider. You should consider whether you understand how CFDs work and whether you can afford to take the high risk of losing your money.
CFDs are complex instruments and come with a high risk of losing money rapidly due to leverage. 70.41% of retail investor accounts lose money when trading CFDs with this provider. You should consider whether you understand how CFDs work and whether you can afford to take the high risk of losing all your money. Read full risk warning.

Crude Oil Analysis

EU Session Analysis for CFD Instruments 28/08/2023

Fundamental analysis

28 August, 2023

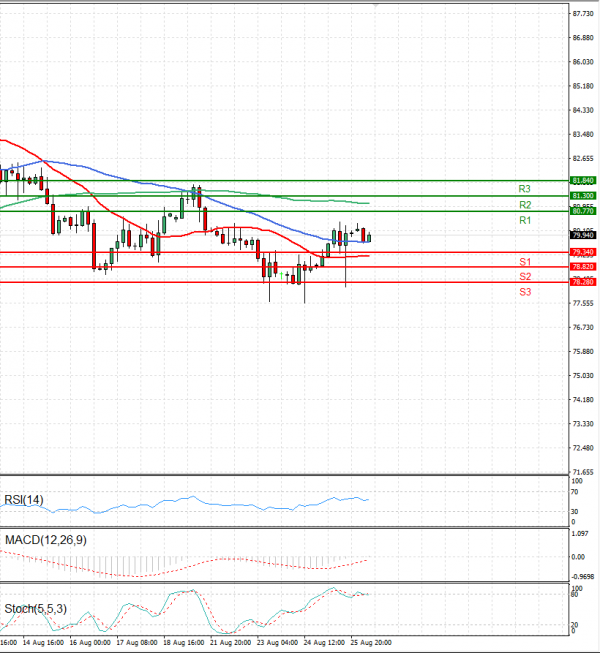
WTI price is regaining ground but is still below $80.00 in early European trading on Friday at 80.03. WTI posted a second week of losses on Friday after Fed Chair Jerome Powell said the US central bank may need to raise rates further to cool still-too-high inflation. Oil rose in early Asian trade before paring gains, as China’s move to halve stamp duty on stock trading to boost struggling markets temporarily pushed up prices. In the United States, energy firms cut the number of active oil rigs for a ninth month in August, Baker Hughes said in a report. Also, Tropical Storm Idalia has formed in the Caribbean and could strengthen into a hurricane and hit Florida. The hurricane is forecast to miss oil and gas centres in the Gulf and the most likely impact is a day or two of power outages according to experts. That should see some short term support for the oil price. However, the narrative of tightening supply, mainly on the back of falling oil inventories and supply cuts by the OPEC+ collective of oil producers, has been eroded by prospects of easing sanctions on Iran and Venezuela, ANZ Research said in a note on Monday.

Technical analysis

Crude Oil Analysis Technical analysis 28/08/2023
Time Frame: 1 hour

CRUDEOIL Support & Resistance Table - 28/08/2023

Support & Resistance Level Explanation
Resistance 2 81.30 Daily R2
Resistance 1 80.77 Daily R1
Support 1 79.34 Daily S1
Support 2 78.82 Daily S2

CRUDEOIL Indicator Table - 28/08/2023

Indicator Signal
SMA 20 Buy
SMA 50 Buy
SMA 100 Sell
MACD( 12;26;9) Sell
RSI (14) Buy
Stochastic ( 9;6;3) Buy

CRUDEOIL Indicator / Period Table - 28/08/2023

Indicator / Period Day - BuyWeek - BuyMonth - Sell
MACD( 12;26;9) Sell BuyBuy
RSI (14) Buy NeutralNeutral
SMA 20 Buy BuySell

CRUDEOIL 28/08/2023 - Reference Price : 79.94

Buy
Simple Moving AverageBuy (2)Sell (1)
Technical Indicators - OscillatorsBuy (2)Sell (1)
Share It With Your Network
Crude OIL Chart
Update Time: -
Highest
Lowest
1M 5M H D W
Prices are loading..
Ready for trading?Start Now