CFDs are complex instruments and come with a high risk of losing money rapidly due to leverage. 77% of retail investor accounts lose money when trading CFDs with this provider. You should consider whether you understand how CFDs work and whether you can afford to take the high risk of losing your money.
CFDs are complex instruments and come with a high risk of losing money rapidly due to leverage. 76% of retail investor accounts lose money when trading CFDs with this provider. You should consider whether you can afford to take the high risk of losing your money.

Gold - Usd Dollar Analysis

EU Session Analysis for CFD Instruments 26/04/2024

Fundamental analysis

26 April, 2024

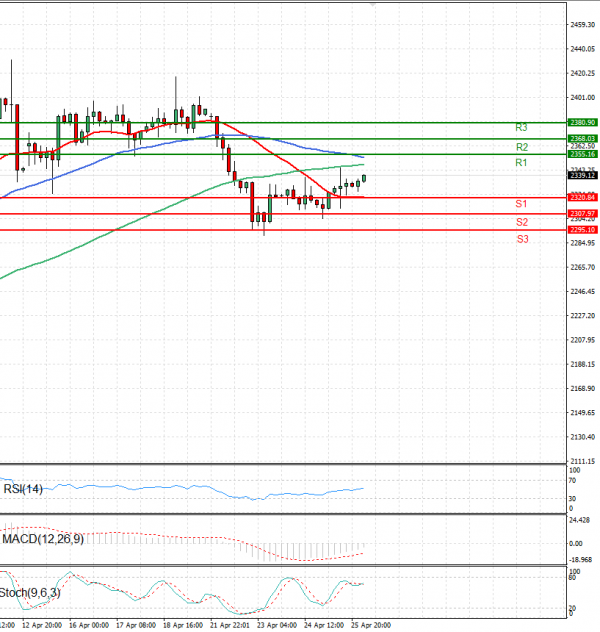
Gold prices are trading in today’s Asian session below 2330 levels.

The price of gold finds it challenging to build upon the slight gains from the previous day and instead fluctuates within a narrow range during the Asian session on Friday, amidst mixed signals from fundamental factors.

The release of the US GDP report on Thursday revealed a notable slowdown in growth momentum at the beginning of 2024, coupled with an unwelcome uptick in inflation.

This, combined with the relatively subdued performance of the US Dollar, provides support for the precious metal, which is often sought as a hedge against inflation.

Nonetheless, the potential for upward movement is limited due to expectations of a hawkish stance from the Federal Reserve (Fed).

Technical analysis

Gold - Usd Dollar Analysis Technical analysis 26/04/2024
Time Frame: 1 hour

GOLD Support & Resistance Table - 26/04/2024

Support & Resistance Level Explanation
Resistance 2 2368.03 Daily R2
Resistance 1 2355.16 Daily R1
Support 1 2320.84 Daily S1
Support 2 2307.97 Daily S2

GOLD Indicator Table - 26/04/2024

Indicator Signal
SMA 20 Buy
SMA 50 Sell
SMA 100 Sell
MACD( 12;26;9) Sell
RSI (14) Buy
Stochastic ( 9;6;3) Buy

GOLD Indicator / Period Table - 26/04/2024

Indicator / Period Day - BuyWeek - BuyMonth - Buy
MACD( 12;26;9) Sell BuyBuy
RSI (14) Buy BuyBuy
SMA 20 Buy BuyBuy

GOLD 26/04/2024 - Reference Price : 2339.12

Buy
Simple Moving AverageBuy (1)Sell (2)
Technical Indicators - OscillatorsBuy (2)Sell (1)
Share It With Your Network
GOLD Chart
Update Time: -
Highest
Lowest
1M 5M H D W
Prices are loading..
Ready for trading?Start Now