Fortrade Canada Ltd. as an order-execution only dealer is not permitted to provide you with any advice or recommendations. These Market Commentaries should not be construed as a recommendation, advice or any attempt by Fortrade Canada Ltd. to prompt or influence you in making an investment decision to purchase, sell, hold or exchange any security or to influence the timing of such activity. This content is produced by Fortrade Limited which is not registered in any capacity with any securities regulatory authority in Canada.
71% of retail investor accounts lose money when trading CFDs with this provider.
CFDs are complex instruments and come with a high risk of losing money rapidly due to leverage. 71% of retail investor accounts lose money when trading CFDs with this provider. You should consider whether you understand how CFDs work and whether you can afford to take the high risk of losing your money.
70.91% of retail investor accounts lose money when trading CFDs with this provider.
CFDs are complex instruments and come with a high risk of losing money rapidly due to leverage. 70.91% of retail investor accounts lose money when trading CFDs with this provider. You should consider whether you understand how CFDs work and whether you can afford to take the high risk of losing all your money. Read full risk warning.
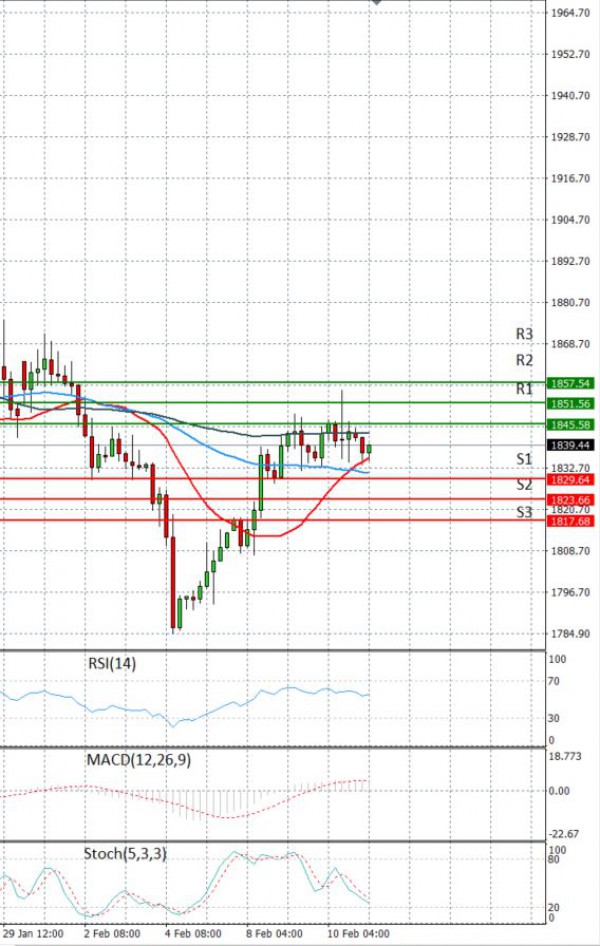
EU Session Analysis for CFD Instruments 11/02/2021
Fundamental analysis
11 February, 2021
Gold edged lower on Thursday as the dollar recovered and softer U.S. inflation data dampened the bullion's appeal as a hedge against inflation. The dollar attempted a rebound from a two week low hit in the previous session, while benchmark 10-year U.S. Treasury yields also steadied. Gold has also lost some support due to a weaker U.S. inflation data as it shows there is not much of inflation down the road. The U.S. Consumer Price Index for January came in lower than expected. U.S. Federal Reserve Chair Jerome Powell in a speech on Wednesday emphasised on the need for fiscal policy and said it is the not the right time to focus on federal debt issues.Investors kept a close watch on the developments on the passage of a $1.9 trillion U.S. relief bill.