Fortrade Canada Ltd. as an order-execution only dealer is not permitted to provide you with any advice or recommendations. These Market Commentaries should not be construed as a recommendation, advice or any attempt by Fortrade Canada Ltd. to prompt or influence you in making an investment decision to purchase, sell, hold or exchange any security or to influence the timing of such activity. This content is produced by Fortrade Limited which is not registered in any capacity with any securities regulatory authority in Canada.
70% of retail investor accounts lose money when trading CFDs with this provider.
CFDs are complex instruments and come with a high risk of losing money rapidly due to leverage. 70% of retail investor accounts lose money when trading CFDs with this provider. You should consider whether you understand how CFDs work and whether you can afford to take the high risk of losing your money.
67.52% of retail investor accounts lose money when trading CFDs with this provider.
CFDs are complex instruments and come with a high risk of losing money rapidly due to leverage. 67.52% of retail investor accounts lose money when trading CFDs with this provider. You should consider whether you understand how CFDs work and whether you can afford to take the high risk of losing all your money. Read full risk warning.
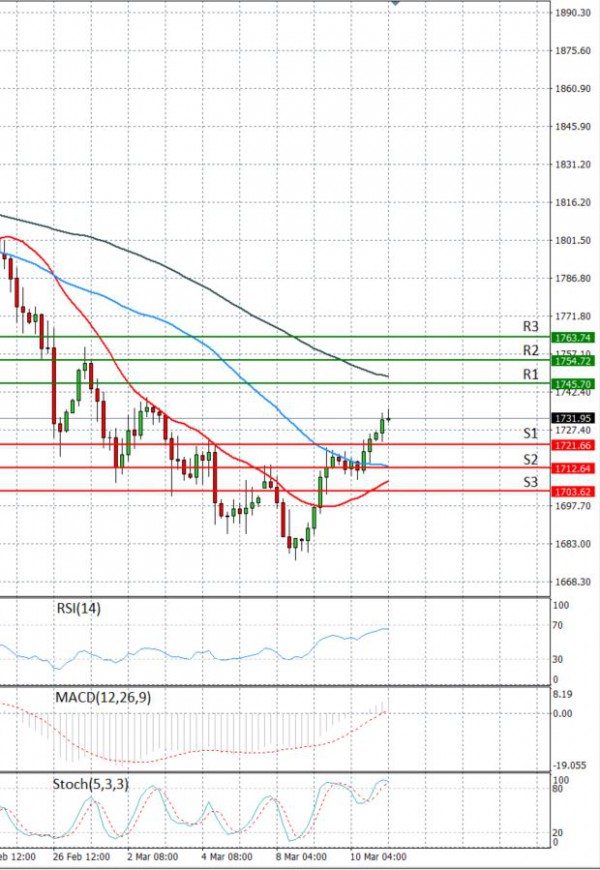
EU Session Analysis for CFD Instruments 12/03/2021
Fundamental analysis
12 March, 2021
Gold prices retreated on Friday as firmer U.S. bond yields and a strong dollar weighed on the metal, but bullion was on course for its biggest weekly gain in seven. The metal's prices had slumped to a nine-month low on Monday, but a pullback in Treasury yields helped spark a rebound that has put gold on track for a weekly gain of 1%. Investors are now awaiting the U.S. Federal Reserve meeting next week for direction on its monetary policy. President Joe Biden on Thursday signed his $1.9 trillion stimulus bill into law and said he was working to speed COVID-19 vaccinations and move the country closer to normality by July 4.