CFDs are complex instruments and come with a high risk of losing money rapidly due to leverage. 66% of retail investor accounts lose money when trading CFDs with this provider. You should consider whether you understand how CFDs work and whether you can afford to take the high risk of losing your money.
CFDs are complex instruments and come with a high risk of losing money rapidly due to leverage. 70.91% of retail investor accounts lose money when trading CFDs with this provider. You should consider whether you understand how CFDs work and whether you can afford to take the high risk of losing all your money. Read full risk warning.

Gold - Usd Dollar Analysis

EU Session Analysis for CFD Instruments 07/04/2021

Fundamental analysis

07 April, 2021

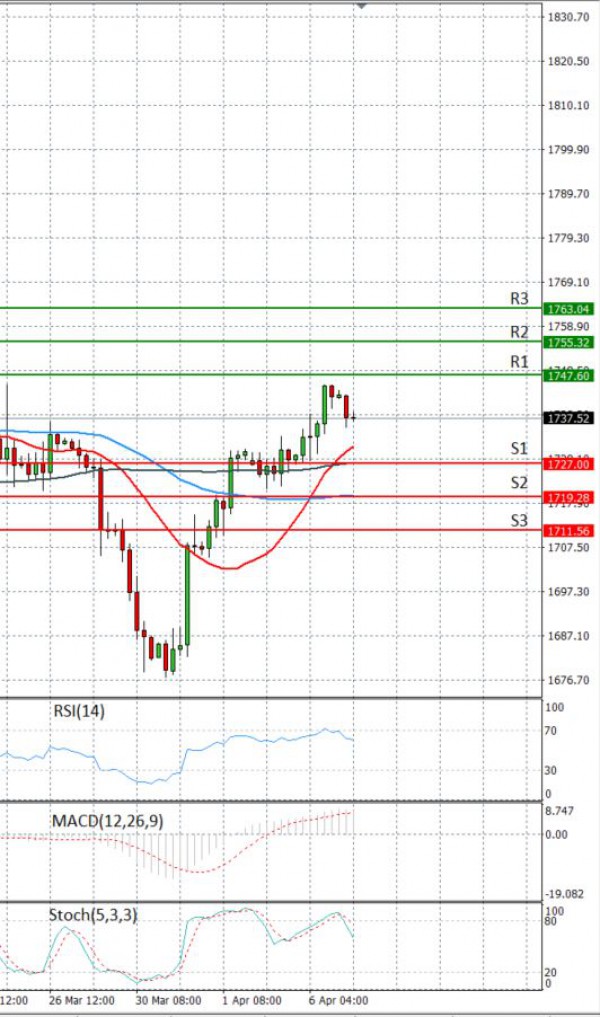
Gold prices fell on Wednesday, from a two-week high hit in the previous session, as an array of strong data from the United States and increased COVID-19 vaccinations lifted hopes of a quick economic recovery, weighing on the metal's safe-haven appeal. Gold prices made a steady climb on Tuesday as long term treasury yields fell and the US Dollar weakened. Bullion prices had jumped on Tuesday to their highest since March 25 at $1,745.15, as U.S. Treasury yields fell and the dollar slipped to a two-week low against a basket of currencies. The International Monetary Fund also raised its outlook for global economic growth, forecasting worldwide output would rise 6% this year. SPDR Gold Trust , the world's largest gold-backed exchange-traded fund, said its holdings fell 0.4% to 1,029.04 tonnes on Tuesday from 1,032.83 tonnes on Monday.

Technical analysis

Gold - Usd Dollar Analysis Technical analysis 07/04/2021
Time Frame: 1 hour

GOLD Support & Resistance Table - 07/04/2021

Support & Resistance Level Explanation
Resistance 2 1755.32 Daily R2
Resistance 1 1747.60 Daily R1
Support 1 1727.00 Daily S1
Support 2 1719.28 Daily S2

GOLD Indicator Table - 07/04/2021

Indicator Signal
SMA 20 Buy
SMA 50 Buy
SMA 100 Buy
MACD( 12;26;9) Buy
RSI (14) Buy
Stochastic ( 9;6;3) Buy

GOLD Indicator / Period Table - 07/04/2021

Indicator / Period Day - BuyWeek - BuyMonth - Sell
MACD( 12;26;9) Buy SellSell
RSI (14) Buy BuySell
SMA 20 Buy BuySell

GOLD 07/04/2021 - Reference Price : 1737.30

Buy
Simple Moving AverageBuy (3)Sell (0)
Technical Indicators - OscillatorsBuy (3)Sell (0)
Share It With Your Network
GOLD Chart
Update Time: -
Highest
Lowest
1M 5M H D W
Prices are loading..
Ready for trading?Start Now