Fortrade Canada Ltd. as an order-execution only dealer is not permitted to provide you with any advice or recommendations. These Market Commentaries should not be construed as a recommendation, advice or any attempt by Fortrade Canada Ltd. to prompt or influence you in making an investment decision to purchase, sell, hold or exchange any security or to influence the timing of such activity. This content is produced by Fortrade Limited which is not registered in any capacity with any securities regulatory authority in Canada.
71% of retail investor accounts lose money when trading CFDs with this provider.
CFDs are complex instruments and come with a high risk of losing money rapidly due to leverage. 71% of retail investor accounts lose money when trading CFDs with this provider. You should consider whether you understand how CFDs work and whether you can afford to take the high risk of losing your money.
70.91% of retail investor accounts lose money when trading CFDs with this provider.
CFDs are complex instruments and come with a high risk of losing money rapidly due to leverage. 70.91% of retail investor accounts lose money when trading CFDs with this provider. You should consider whether you understand how CFDs work and whether you can afford to take the high risk of losing all your money. Read full risk warning.
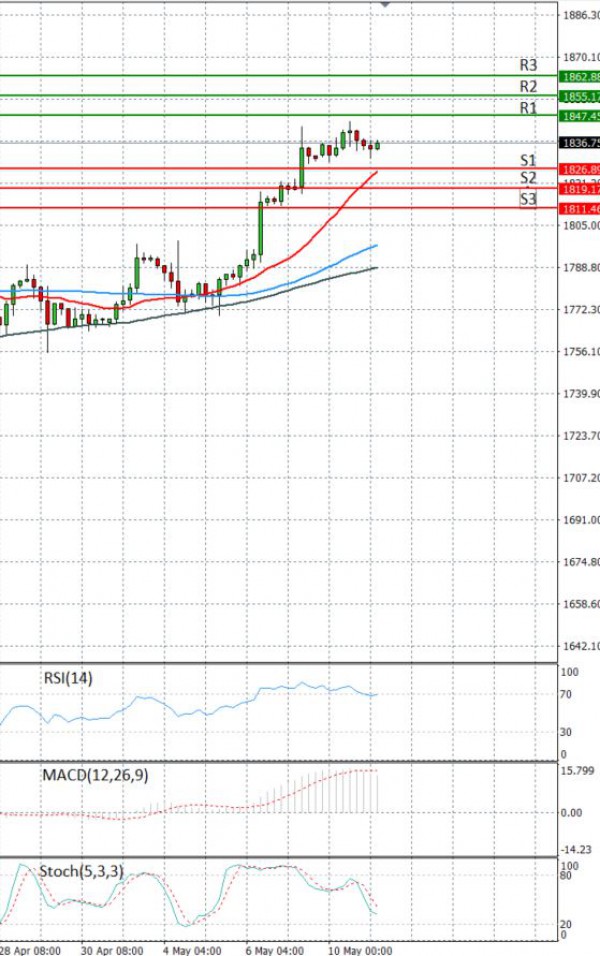
EU Session Analysis for CFD Instruments 11/05/2021
Fundamental analysis
11 May, 2021
Gold prices held steady on Tuesday as investors awaited U.S. consumer price data due later this week to measure whether inflationary pressure is building, with a weaker dollar and a pullback in Treasury yields supporting the metal. Benchmark U.S. 10-year Treasury yields were pinned below 1.6%, reducing the opportunity cost of holding non-yielding gold. Making gold less expensive for other currency holders, the dollar index hovered close to a more than two-month low hit in the previous session after U.S. non-farm payrolls data on Friday showed jobs growth unexpectedly slowed in April. Investors are waiting for the U.S. consumer price index report due on Wednesday to gauge inflationary pressure and the Federal reserve’s policy stance.