Fortrade Canada Ltd. as an order-execution only dealer is not permitted to provide you with any advice or recommendations. These Market Commentaries should not be construed as a recommendation, advice or any attempt by Fortrade Canada Ltd. to prompt or influence you in making an investment decision to purchase, sell, hold or exchange any security or to influence the timing of such activity. This content is produced by Fortrade Limited which is not registered in any capacity with any securities regulatory authority in Canada.
69% of retail investor accounts lose money when trading CFDs with this provider.
CFDs are complex instruments and come with a high risk of losing money rapidly due to leverage. 69% of retail investor accounts lose money when trading CFDs with this provider. You should consider whether you understand how CFDs work and whether you can afford to take the high risk of losing your money.
67.52% of retail investor accounts lose money when trading CFDs with this provider.
CFDs are complex instruments and come with a high risk of losing money rapidly due to leverage. 67.52% of retail investor accounts lose money when trading CFDs with this provider. You should consider whether you understand how CFDs work and whether you can afford to take the high risk of losing all your money. Read full risk warning.
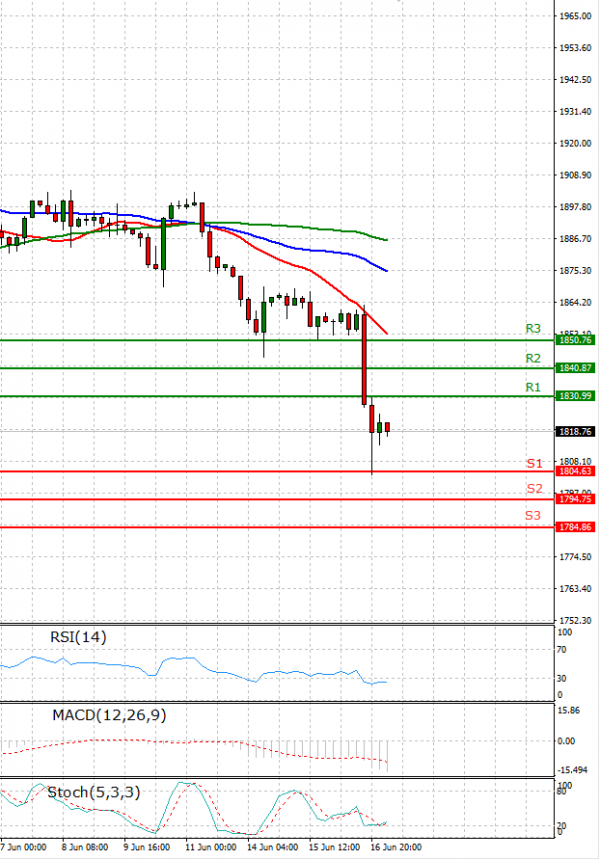
EU Session Analysis for CFD Instruments 17/06/2021
Fundamental analysis
17 June, 2021
Gold prices rose on Thursday as investors took advantage of a sharp fall in the previous session to buy the metal after the U.S. Federal Reserve signalled it might raise interest rates sooner than expected. The Fed on Wednesday began closing the door on its pandemic-driven monetary policy with 11 out of 18 Fed officials projecting at least two quarter-point interest rate increases for 2023. Gold is seen as a hedge against inflation, but an increase in rates from the Fed will dull bullion’s appeal as it translates into higher opportunity cost of holding it. Gold prices slipped more than 2.5% on Wednesday to its lowest since May 6 after hawkish comments from Fed officials lifted the dollar to a two-month high, while 10-year U.S. Treasury yields jumped.