Fortrade Canada Ltd. as an order-execution only dealer is not permitted to provide you with any advice or recommendations. These Market Commentaries should not be construed as a recommendation, advice or any attempt by Fortrade Canada Ltd. to prompt or influence you in making an investment decision to purchase, sell, hold or exchange any security or to influence the timing of such activity. This content is produced by Fortrade Limited which is not registered in any capacity with any securities regulatory authority in Canada.
69% of retail investor accounts lose money when trading CFDs with this provider.
CFDs are complex instruments and come with a high risk of losing money rapidly due to leverage. 69% of retail investor accounts lose money when trading CFDs with this provider. You should consider whether you understand how CFDs work and whether you can afford to take the high risk of losing your money.
67.52% of retail investor accounts lose money when trading CFDs with this provider.
CFDs are complex instruments and come with a high risk of losing money rapidly due to leverage. 67.52% of retail investor accounts lose money when trading CFDs with this provider. You should consider whether you understand how CFDs work and whether you can afford to take the high risk of losing all your money. Read full risk warning.
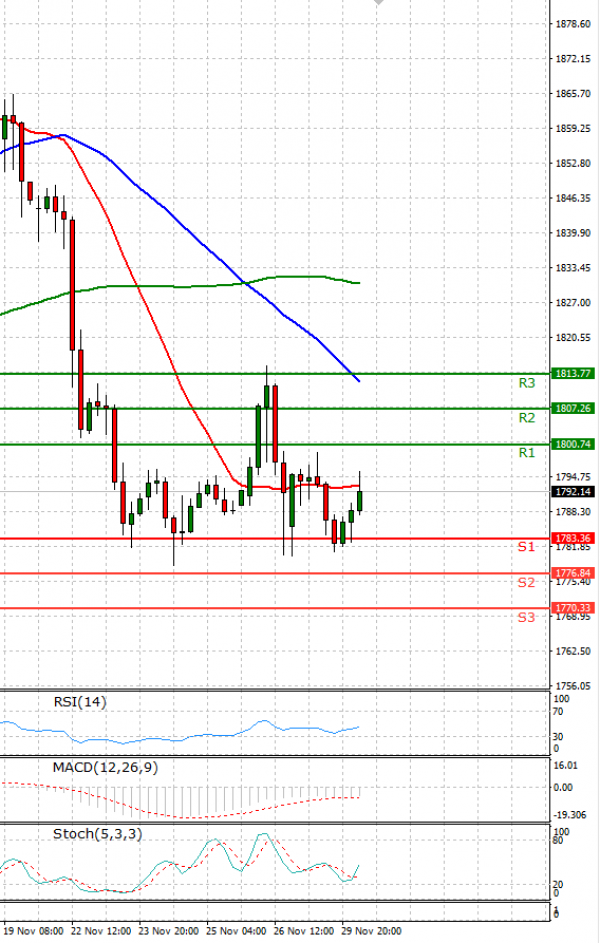
EU Session Analysis for CFD Instruments 30/11/2021
Fundamental analysis
30 November, 2021
Gold prices edged higher on Tuesday, drawing some support from a subdued dollar as investors assessed the severity of the Omicron coronavirus variant's impact on the global economy. The dollar index edged 0.1% lower, reducing the metal's cost to buyers holding other currencies. A growing number of countries have imposed travel restrictions to limit the spread of the newly discovered COVID-19 variant, which the World Health Organization said on Monday carried a very high risk of infection surges. The yield on 10-year Treasury inflation-protected securities (TIPS) has recovered from a record low hit earlier in the month. However, it is still in negative territory, at -1.05% on Tuesday, keeping gold's opportunity cost low. Investors now await Federal Reserve Chairman Jerome Powell's congressional testimony later this week after his warning on Monday that the new COVID-19 strain muddied the central bank's inflation outlook and prices could continue to rise for longer than earlier thought.