Fortrade Canada Ltd. as an order-execution only dealer is not permitted to provide you with any advice or recommendations. These Market Commentaries should not be construed as a recommendation, advice or any attempt by Fortrade Canada Ltd. to prompt or influence you in making an investment decision to purchase, sell, hold or exchange any security or to influence the timing of such activity. This content is produced by Fortrade Limited which is not registered in any capacity with any securities regulatory authority in Canada.
71% of retail investor accounts lose money when trading CFDs with this provider.
CFDs are complex instruments and come with a high risk of losing money rapidly due to leverage. 71% of retail investor accounts lose money when trading CFDs with this provider. You should consider whether you understand how CFDs work and whether you can afford to take the high risk of losing your money.
70.41% of retail investor accounts lose money when trading CFDs with this provider.
CFDs are complex instruments and come with a high risk of losing money rapidly due to leverage. 70.41% of retail investor accounts lose money when trading CFDs with this provider. You should consider whether you understand how CFDs work and whether you can afford to take the high risk of losing all your money. Read full risk warning.
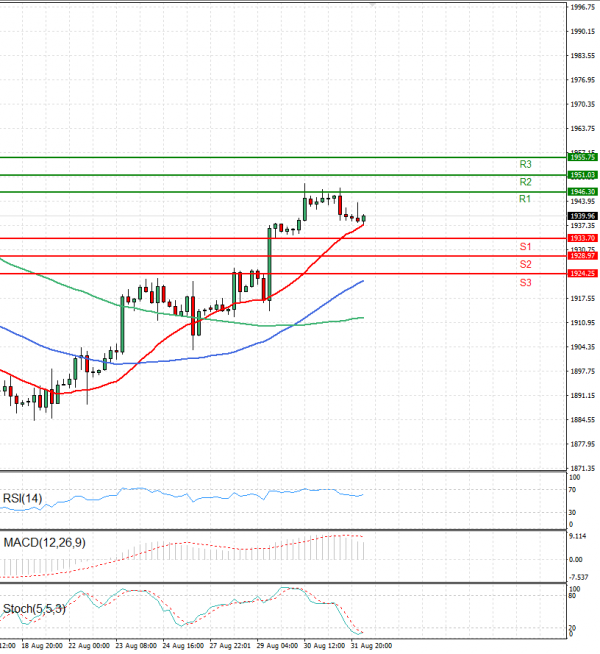
EU Session Analysis for CFD Instruments 01/09/2023
Fundamental analysis
01 September, 2023
Gold prices moved little on Friday, steadying near three-week highs as markets awaited more cues on U.S. monetary policy from nonfarm payrolls data due later in the day, while copper prices rose on positive Chinese factory data. The yellow metal had a strong run-up this week as a string of weak U.S. economic readings spurred bets that the Federal Reserve will keep rates on hold in September, which in turn dented the dollar. But the greenback rebounded on Thursday after data showed personal consumption expenditures- the Fed’s preferred inflation gauge- remained sticky in July, while personal spending grew more than expected. This saw gold consolidate some weekly gains. Spot gold steadied at $1,940.14 an ounce, while gold futures expiring in December were flat at $1,966.55 an ounce. Both instruments were still trading up between 1% and 3% for the week.