CFDs are complex instruments and come with a high risk of losing money rapidly due to leverage. 71% of retail investor accounts lose money when trading CFDs with this provider. You should consider whether you understand how CFDs work and whether you can afford to take the high risk of losing your money.
CFDs are complex instruments and come with a high risk of losing money rapidly due to leverage. 70.91% of retail investor accounts lose money when trading CFDs with this provider. You should consider whether you understand how CFDs work and whether you can afford to take the high risk of losing all your money. Read full risk warning.

Gold - Usd Dollar Analysis

EU Session Analysis for CFD Instruments 06/09/2023

Fundamental analysis

06 September, 2023

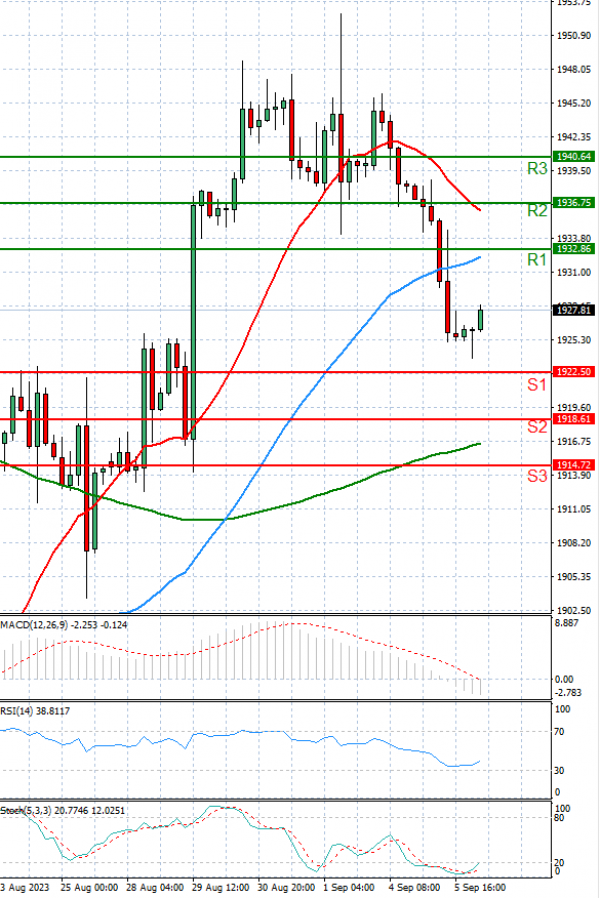
Gold spot and future prices early Wednesday morning stand lower at 1,926 and 1,953, respectively.

Gold prices moved little in Asian trade on Wednesday, pressured by overnight strength in the dollar and Treasury yields as markets awaited more cues on U.S. monetary policy from several Federal Reserve officials this week.

While the yellow metal recovered sharply from five-month lows over the past two weeks, it has struggled to make headway in recent sessions due to pressure from renewed strength in the dollar and yields.

The greenback traded near a six-month high on Wednesday, while 10-year Treasury yields hovered close to their strongest levels in over 20 years.

U.S. rates are widely expected to remain higher for longer this year, diminishing the prospect of any major gains in gold as high rates push up the opportunity cost of investing in the yellow metal.

Lower chances of a U.S. recession this year have also weighed on gold, which usually benefits from a risk-off environment.

Technical analysis

Gold - Usd Dollar Analysis Technical analysis 06/09/2023
Time Frame: 1 hour

GOLD Support & Resistance Table - 06/09/2023

Support & Resistance Level Explanation
Resistance 2 1936.75 Daily R2
Resistance 1 1932.86 Daily R1
Support 1 1922.50 Daily S1
Support 2 1918.61 Daily S2

GOLD Indicator Table - 06/09/2023

Indicator Signal
SMA 20 Sell
SMA 50 Sell
SMA 100 Buy
MACD( 12;26;9) Neutral
RSI (14) Sell
Stochastic ( 9;6;3) Sell

GOLD Indicator / Period Table - 06/09/2023

Indicator / Period Day - SellWeek - SellMonth - Buy
MACD( 12;26;9) Neutral NeutralBuy
RSI (14) Sell NeutralBuy
SMA 20 Sell BuySell

GOLD 06/09/2023 - Reference Price : 1927.68

Sell
Simple Moving AverageBuy (1)Sell (2)
Technical Indicators - OscillatorsBuy (0)Sell (2)
Share It With Your Network
GOLD Chart
Update Time: -
Highest
Lowest
1M 5M H D W
Prices are loading..
Ready for trading?Start Now