CFDs are complex instruments and come with a high risk of losing money rapidly due to leverage. 71% of retail investor accounts lose money when trading CFDs with this provider. You should consider whether you understand how CFDs work and whether you can afford to take the high risk of losing your money.
CFDs are complex instruments and come with a high risk of losing money rapidly due to leverage. 70.41% of retail investor accounts lose money when trading CFDs with this provider. You should consider whether you understand how CFDs work and whether you can afford to take the high risk of losing all your money. Read full risk warning.

Gold - Usd Dollar Analysis

EU Session Analysis for CFD Instruments 07/09/2023

Fundamental analysis

07 September, 2023

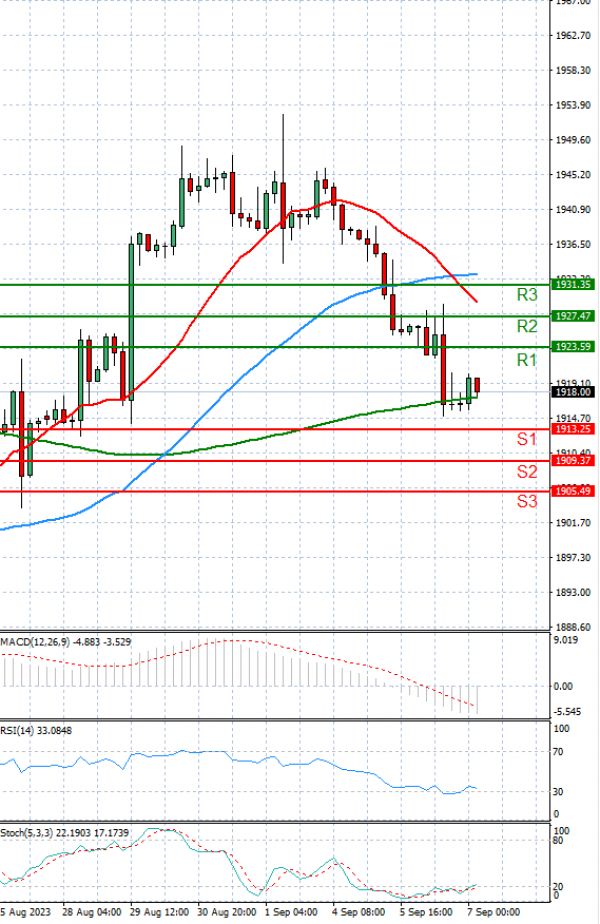
Gold spot and future prices early Thursday morning stand lower at 1,918 and 1,941, respectively.

Gold price has found fresh buyers once again near $1,915, making a minor recovery attempt early Thursday. The United States Dollar (USD) is in a bullish consolidation phase near six-month highs, as US Treasury bond yields take a breather ahead of US economic data and Fedspeak.

Risk-off flows extend into Asian trading on Thursday. China’s economic worries, resurfacing inflation concerns on higher oil prices, and increased bets for further US Federal Reserve (Fed) policy tightening continue to weigh on the market’s sentiment. The tepid mood keeps the buoyant tone intact around the safe-haven US Dollar, as it hangs near six-month highs against its major peers, allowing Gold price to stage a minor comeback.

Technical analysis

Gold - Usd Dollar Analysis Technical analysis 07/09/2023
Time Frame: 1 hour

GOLD Support & Resistance Table - 07/09/2023

Support & Resistance Level Explanation
Resistance 2 1927.47 Daily R2
Resistance 1 1923.59 Daily R1
Support 1 1913.25 Daily S1
Support 2 1909.37 Daily S2

GOLD Indicator Table - 07/09/2023

Indicator Signal
SMA 20 Sell
SMA 50 Sell
SMA 100 Buy
MACD( 12;26;9) Sell
RSI (14) Sell
Stochastic ( 9;6;3) Sell

GOLD Indicator / Period Table - 07/09/2023

Indicator / Period Day - SellWeek - SellMonth - Sell
MACD( 12;26;9) Sell NeutralBuy
RSI (14) Sell SellSell
SMA 20 Sell NeutralSell

GOLD 07/09/2023 - Reference Price : 1918.42

Sell
Simple Moving AverageBuy (1)Sell (2)
Technical Indicators - OscillatorsBuy (0)Sell (3)
Share It With Your Network
GOLD Chart
Update Time: -
Highest
Lowest
1M 5M H D W
Prices are loading..
Ready for trading?Start Now