CFDs are complex instruments and come with a high risk of losing money rapidly due to leverage. 71% of retail investor accounts lose money when trading CFDs with this provider. You should consider whether you understand how CFDs work and whether you can afford to take the high risk of losing your money.
CFDs are complex instruments and come with a high risk of losing money rapidly due to leverage. 70.41% of retail investor accounts lose money when trading CFDs with this provider. You should consider whether you understand how CFDs work and whether you can afford to take the high risk of losing all your money. Read full risk warning.

Gold - Usd Dollar Analysis

EU Session Analysis for CFD Instruments 20/03/2024

Fundamental analysis

20 March, 2024

Gold prices are trading in today’s Asian session above 2150 levels.

In Asian trading on Wednesday, gold prices showed little movement, stabilising amidst recent volatility as investors awaited guidance from the Federal Reserve regarding potential interest rate cuts in 2024.

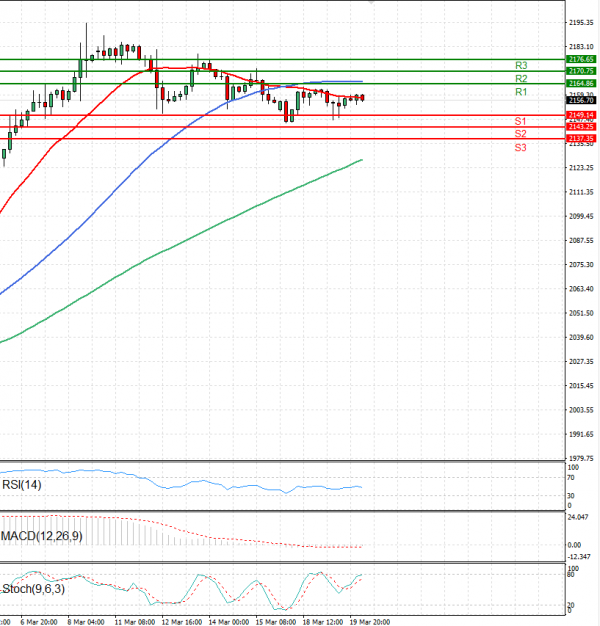
Despite remaining significantly below the peak levels reached earlier in March, gold prices seemed to have found support near the $2,150 per ounce mark.

Attention in the metal markets has shifted towards the conclusion of the Fed meeting scheduled for later today, with widespread anticipation that the central bank will maintain current interest rates.

However, the market is keenly attuned to any indications regarding future interest rate cuts in 2024, with particular interest in insights provided during the press conference with Fed Chair Jerome Powell following the meeting.

Technical analysis

Gold - Usd Dollar Analysis Technical analysis 20/03/2024
Time Frame: 1 hour

GOLD Support & Resistance Table - 20/03/2024

Support & Resistance Level Explanation
Resistance 2 2170.75 Daily R2
Resistance 1 2164.86 Daily R1
Support 1 2149.14 Daily S1
Support 2 2143.25 Daily S2

GOLD Indicator Table - 20/03/2024

Indicator Signal
SMA 20 Sell
SMA 50 Sell
SMA 100 Buy
MACD( 12;26;9) Sell
RSI (14) Sell
Stochastic ( 9;6;3) Buy

GOLD Indicator / Period Table - 20/03/2024

Indicator / Period Day - SellWeek - BuyMonth - Buy
MACD( 12;26;9) Sell BuyBuy
RSI (14) Sell BuyBuy
SMA 20 Sell BuyBuy

GOLD 20/03/2024 - Reference Price : 2156.70

Sell
Simple Moving AverageBuy (1)Sell (2)
Technical Indicators - OscillatorsBuy (1)Sell (2)
Share It With Your Network
GOLD Chart
Update Time: -
Highest
Lowest
1M 5M H D W
Prices are loading..
Ready for trading?Start Now