CFDs are complex instruments and come with a high risk of losing money rapidly due to leverage. 71% of retail investor accounts lose money when trading CFDs with this provider. You should consider whether you understand how CFDs work and whether you can afford to take the high risk of losing your money.
CFDs are complex instruments and come with a high risk of losing money rapidly due to leverage. 70.41% of retail investor accounts lose money when trading CFDs with this provider. You should consider whether you understand how CFDs work and whether you can afford to take the high risk of losing all your money. Read full risk warning.

Gold - Usd Dollar Analysis

EU Session Analysis for CFD Instruments 30/05/2024

Fundamental analysis

30 May, 2024

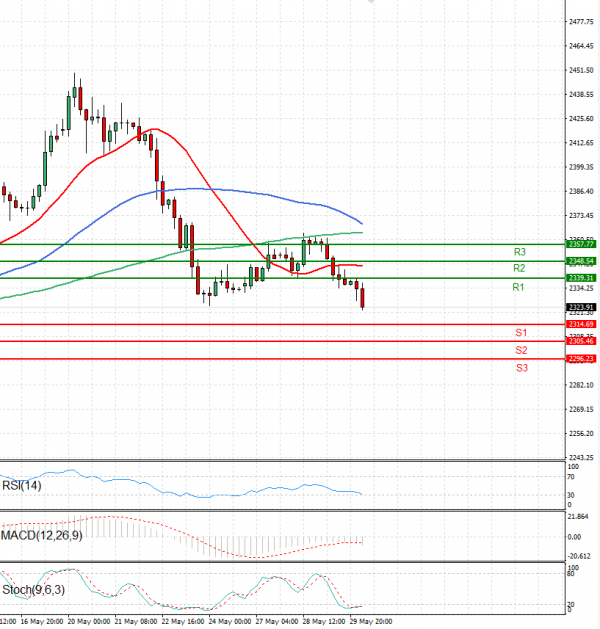
Gold prices are trading in today’s Asian session below 2330 levels.

Gold prices declined in Asian trade on Thursday, primarily due to the strengthening of the dollar and rising U.S. Treasury yields. Traders remained cautious ahead of key economic data that could influence interest rates.

The dollar reached a two-week high as concerns about prolonged high U.S. interest rates led traders to favour the greenback. Benchmark U.S. Treasury yields also increased this week.

This shift caused some investors to move away from gold, pushing the metal further from the record highs reached last week and erasing most of the gains made earlier this week.

Technical analysis

Gold - Usd Dollar Analysis Technical analysis 30/05/2024
Time Frame: 1 hour

GOLD Support & Resistance Table - 30/05/2024

Support & Resistance Level Explanation
Resistance 2 2348.54 Daily R2
Resistance 1 2339.31 Daily R1
Support 1 2314.69 Daily S1
Support 2 2305.46 Daily S2

GOLD Indicator Table - 30/05/2024

Indicator Signal
SMA 20 Sell
SMA 50 Sell
SMA 100 Sell
MACD( 12;26;9) Sell
RSI (14) Sell
Stochastic ( 9;6;3) Neutral

GOLD Indicator / Period Table - 30/05/2024

Indicator / Period Day - SellWeek - BuyMonth - Buy
MACD( 12;26;9) Sell BuyBuy
RSI (14) Sell BuyBuy
SMA 20 Sell BuyBuy

GOLD 30/05/2024 - Reference Price : 2323.91

Sell
Simple Moving AverageBuy (0)Sell (3)
Technical Indicators - OscillatorsBuy (0)Sell (2)
Share It With Your Network
GOLD Chart
Update Time: -
Highest
Lowest
1M 5M H D W
Prices are loading..
Ready for trading?Start Now