Fortrade Canada Ltd. as an order-execution only dealer is not permitted to provide you with any advice or recommendations. These Market Commentaries should not be construed as a recommendation, advice or any attempt by Fortrade Canada Ltd. to prompt or influence you in making an investment decision to purchase, sell, hold or exchange any security or to influence the timing of such activity. This content is produced by Fortrade Limited which is not registered in any capacity with any securities regulatory authority in Canada.
69% of retail investor accounts lose money when trading CFDs with this provider.
CFDs are complex instruments and come with a high risk of losing money rapidly due to leverage. 69% of retail investor accounts lose money when trading CFDs with this provider. You should consider whether you understand how CFDs work and whether you can afford to take the high risk of losing your money.
70.88% of retail investor accounts lose money when trading CFDs with this provider.
CFDs are complex instruments and come with a high risk of losing money rapidly due to leverage. 70.88% of retail investor accounts lose money when trading CFDs with this provider. You should consider whether you understand how CFDs work and whether you can afford to take the high risk of losing all your money. Read full risk warning.
EU Session Analysis for CFD Instruments 13/03/2026
Fundamental analysis
13 March, 2026
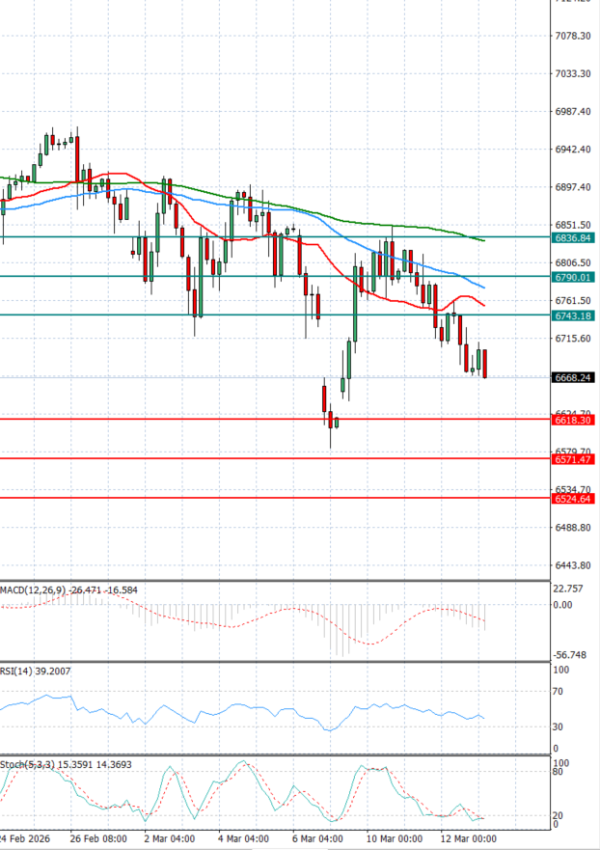
The USA500 is currently trading below 6,800 levels.
U.S. stocks fell on Thursday, after the Middle East conflict triggered crude prices to surge toward $100 again, adding to inflation fears, reducing the chances of Fed rate cuts, and sending investors fleeing equity markets.
On Thursday the S&P 500 declined 1.52%, the Dow Jones fell 1.56% and the Nasdaq dropped 1.78%.