CFDs are complex instruments and come with a high risk of losing money rapidly due to leverage. 77% of retail investor accounts lose money when trading CFDs with this provider. You should consider whether you understand how CFDs work and whether you can afford to take the high risk of losing your money.
CFDs are complex instruments and come with a high risk of losing money rapidly due to leverage. 76% of retail investor accounts lose money when trading CFDs with this provider. You should consider whether you can afford to take the high risk of losing your money.

USA500 Analysis

EU Session Analysis for CFD Instruments 26/04/2024

Fundamental analysis

26 April, 2024

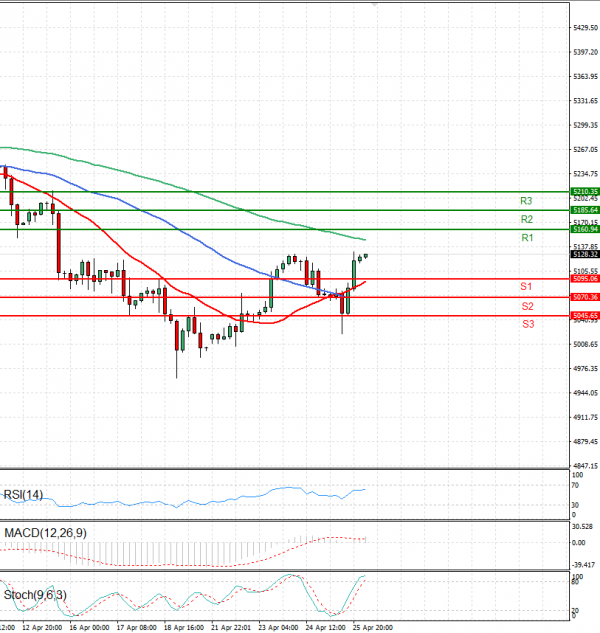
The USA500 is currently trading above 5,000 levels.

In Thursday's evening trading, U.S. stock index futures surged notably, with a notable emphasis on technology stocks, driven by robust earnings reports from Microsoft and Alphabet.

Despite lingering concerns regarding U.S. inflation and interest rates, the optimistic earnings reports fueled expectations that the demand for artificial intelligence will continue to bolster tech sector earnings in the forthcoming quarter.

Among the various futures, Nasdaq 100 Futures exhibited the strongest performance, climbing by 1.2%, while S&P 500 Futures saw a rise of 0.8%. Conversely, the gains in Dow Jones Futures were more subdued, registering a modest increase of 0.1%.

Technical analysis

USA500 Analysis Technical analysis 26/04/2024
Time Frame: 1 hour

USA500 Support & Resistance Table - 26/04/2024

Support & Resistance Level Explanation
Resistance 2 5185.64 Daily R2
Resistance 1 5160.94 Daily R1
Support 1 5095.06 Daily S1
Support 2 5070.38 Daily S2

USA500 Indicator Table - 26/04/2024

Indicator Signal
SMA 20 Buy
SMA 50 Buy
SMA 100 Sell
MACD( 12;26;9) Buy
RSI (14) Buy
Stochastic ( 9;6;3) Neutral

USA500 Indicator / Period Table - 26/04/2024

Indicator / Period Day - BuyWeek - BuyMonth - Buy
MACD( 12;26;9) Buy BuyBuy
RSI (14) Buy BuyBuy
SMA 20 Buy BuyBuy

USA500 26/04/2024 - Reference Price : 5128.32

Buy
Simple Moving AverageBuy (2)Sell (1)
Technical Indicators - OscillatorsBuy (2)Sell (0)
Share It With Your Network
USA500 Chart
Update Time: -
Highest
Lowest
1M 5M H D W
Prices are loading..
Ready for trading?Start Now