Fortrade Canada Ltd. as an order-execution only dealer is not permitted to provide you with any advice or recommendations. These Market Commentaries should not be construed as a recommendation, advice or any attempt by Fortrade Canada Ltd. to prompt or influence you in making an investment decision to purchase, sell, hold or exchange any security or to influence the timing of such activity. This content is produced by Fortrade Limited which is not registered in any capacity with any securities regulatory authority in Canada.
71% of retail investor accounts lose money when trading CFDs with this provider.
CFDs are complex instruments and come with a high risk of losing money rapidly due to leverage. 71% of retail investor accounts lose money when trading CFDs with this provider. You should consider whether you understand how CFDs work and whether you can afford to take the high risk of losing your money.
70.41% of retail investor accounts lose money when trading CFDs with this provider.
CFDs are complex instruments and come with a high risk of losing money rapidly due to leverage. 70.41% of retail investor accounts lose money when trading CFDs with this provider. You should consider whether you understand how CFDs work and whether you can afford to take the high risk of losing all your money. Read full risk warning.
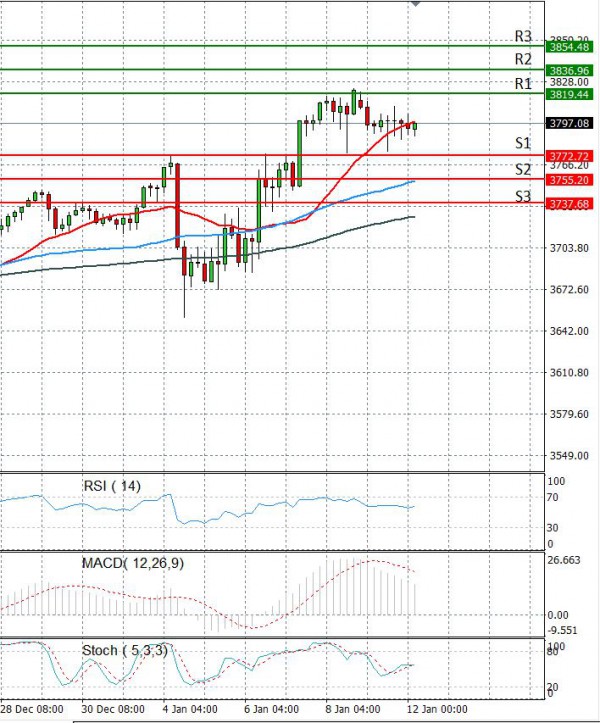
EU Session Analysis for CFD Instruments 12/01/2021
Fundamental analysis
12 January, 2021
Wall Street’s main indexes closed lower on Monday as investors took some profits after last weeks’ record levels while they waited for earnings season to begin and eyed events in Washington with trepidation. U.S. stocks had rallied last week as investors bet that Democrats’ win of Georgia runoff elections would bring a higher likelihood of a heftier fiscal stimulus package to boost the pandemic-savaged economy. But some investors worried stimulus could be delayed as House Democrats introduced a resolution to impeach U.S. President Donald Trump, accusing him of inciting insurrection following a violent attack on the Capitol by his supporters. The USA500 slipped on Monday, with technology shares getting hit harder than value stocks.