Fortrade Canada Ltd. as an order-execution only dealer is not permitted to provide you with any advice or recommendations. These Market Commentaries should not be construed as a recommendation, advice or any attempt by Fortrade Canada Ltd. to prompt or influence you in making an investment decision to purchase, sell, hold or exchange any security or to influence the timing of such activity. This content is produced by Fortrade Limited which is not registered in any capacity with any securities regulatory authority in Canada.
71% of retail investor accounts lose money when trading CFDs with this provider.
CFDs are complex instruments and come with a high risk of losing money rapidly due to leverage. 71% of retail investor accounts lose money when trading CFDs with this provider. You should consider whether you understand how CFDs work and whether you can afford to take the high risk of losing your money.
70.41% of retail investor accounts lose money when trading CFDs with this provider.
CFDs are complex instruments and come with a high risk of losing money rapidly due to leverage. 70.41% of retail investor accounts lose money when trading CFDs with this provider. You should consider whether you understand how CFDs work and whether you can afford to take the high risk of losing all your money. Read full risk warning.
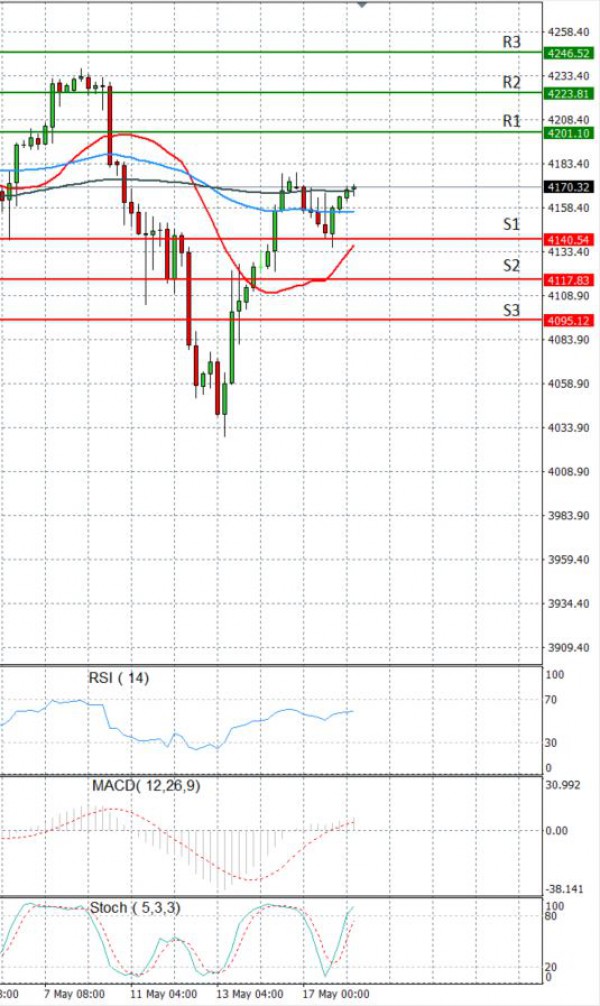
EU Session Analysis for CFD Instruments 18/05/2021
Fundamental analysis
18 May, 2021
Wall Street stocks ended lower on Monday, weighed down by tech shares as signs of growing inflation worried investors about the potential for tighter monetary policy. The S&P 500 scored its biggest one-day jump in more than a month on Friday as investors picked up beaten-down stocks following a pullback earlier in the week on worries about inflation and a sooner-than-expected tightening by the U.S. Federal Reserve. Cryptocurrency-related stocks like Marathon Digital, Riot Blockchain and Coinbase fell as bitcoin swung in volatile trading after Tesla Inc boss Elon Musk tweeted about the carmaker’s bitcoin holdings. As the earnings season draws to a close Walmart is due to declare its earnings today.