Fortrade Canada Ltd. as an order-execution only dealer is not permitted to provide you with any advice or recommendations. These Market Commentaries should not be construed as a recommendation, advice or any attempt by Fortrade Canada Ltd. to prompt or influence you in making an investment decision to purchase, sell, hold or exchange any security or to influence the timing of such activity. This content is produced by Fortrade Limited which is not registered in any capacity with any securities regulatory authority in Canada.
71% of retail investor accounts lose money when trading CFDs with this provider.
CFDs are complex instruments and come with a high risk of losing money rapidly due to leverage. 71% of retail investor accounts lose money when trading CFDs with this provider. You should consider whether you understand how CFDs work and whether you can afford to take the high risk of losing your money.
70.91% of retail investor accounts lose money when trading CFDs with this provider.
CFDs are complex instruments and come with a high risk of losing money rapidly due to leverage. 70.91% of retail investor accounts lose money when trading CFDs with this provider. You should consider whether you understand how CFDs work and whether you can afford to take the high risk of losing all your money. Read full risk warning.
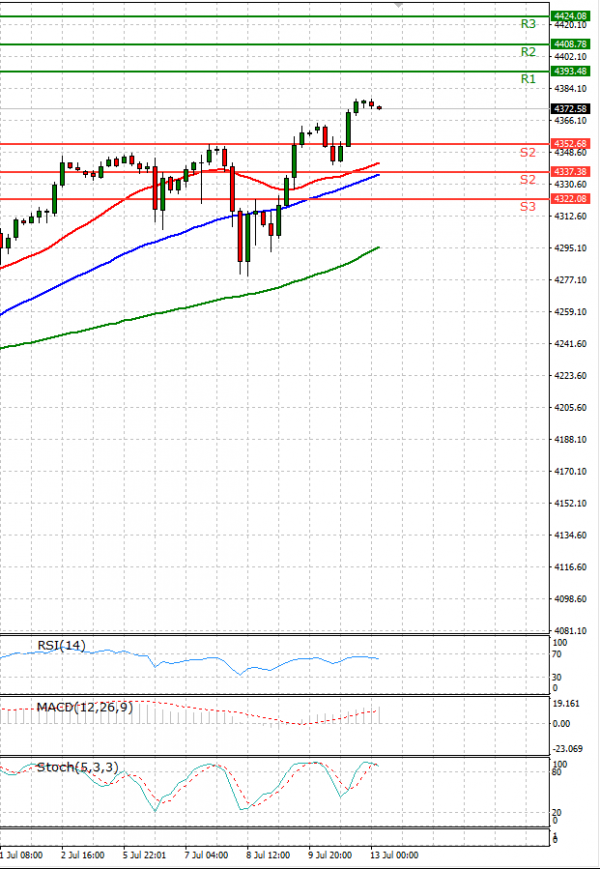
EU Session Analysis for CFD Instruments 13/07/2021
Fundamental analysis
13 July, 2021
Wall Street’s main indexes closed at their highest levels ever on Monday, lifted by Tesla and bank stocks as investors eyed the start of the second-quarter earnings season and a batch of economic data. Tesla rallied and was a major contributor to gains in the S&P 500 and Nasdaq. CEO Elon Musk insisted in court on Monday he does not control Tesla, and he said he did not enjoy being the electric vehicle company’s chief executive as he took the stand to defend the company’s 2016 acquisition of SolarCity. The S&P 500 banks index climbed ahead of quarterly earnings reports this week from major banks, including Goldman Sachs and JPMorgan on Tuesday. JPMorgan Chase and Goldman Sachs rallied and helped drive the Dow to record highs. Investors will closely watch quarterly reports for early clues on the how long the U.S. economic recovery may last, with June-quarter earnings per share for S&P 500 companies expected to rise 66%, according to IBES data from Refinitiv.