Fortrade Canada Ltd. as an order-execution only dealer is not permitted to provide you with any advice or recommendations. These Market Commentaries should not be construed as a recommendation, advice or any attempt by Fortrade Canada Ltd. to prompt or influence you in making an investment decision to purchase, sell, hold or exchange any security or to influence the timing of such activity. This content is produced by Fortrade Limited which is not registered in any capacity with any securities regulatory authority in Canada.
69% of retail investor accounts lose money when trading CFDs with this provider.
CFDs are complex instruments and come with a high risk of losing money rapidly due to leverage. 69% of retail investor accounts lose money when trading CFDs with this provider. You should consider whether you understand how CFDs work and whether you can afford to take the high risk of losing your money.
70.88% of retail investor accounts lose money when trading CFDs with this provider.
CFDs are complex instruments and come with a high risk of losing money rapidly due to leverage. 70.88% of retail investor accounts lose money when trading CFDs with this provider. You should consider whether you understand how CFDs work and whether you can afford to take the high risk of losing all your money. Read full risk warning.
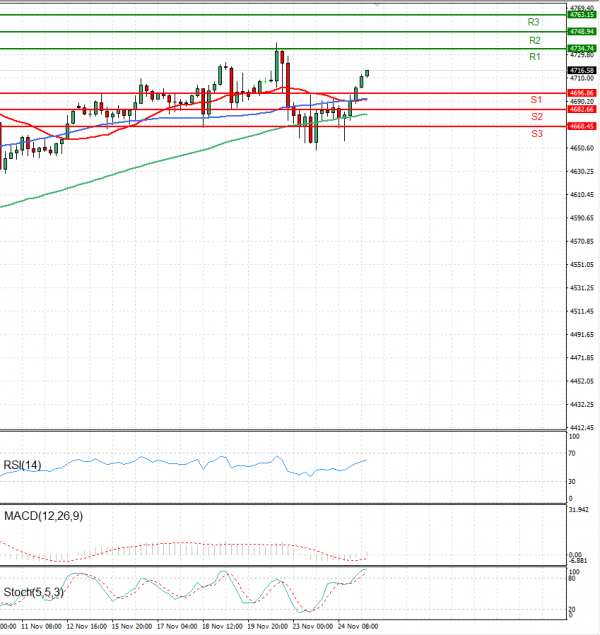
EU Session Analysis for CFD Instruments 25/11/2021
Fundamental analysis
25 November, 2021
Wall Street ended higher on Wednesday, lifted by gains in Nvidia and other tech stocks, while Gap and Nordstrom shares tumbled following weak quarterly reports. Nvidia rallied as it bounced back from a selloff in Big Tech stocks early this week. The graphics chipmaker is now up about 150% in 2021. Various Federal Reserve policymakers said they would be open to speeding up elimination of their bond-buying program and move more quickly to raise interest rates if high inflation held, minutes of the U.S. central bank's last policy meeting showed. Other data showed weekly jobless claims fell and third-quarter GDP was revised higher, while a University of Michigan survey showed consumer sentiment improved in November.