Fortrade Canada Ltd. as an order-execution only dealer is not permitted to provide you with any advice or recommendations. These Market Commentaries should not be construed as a recommendation, advice or any attempt by Fortrade Canada Ltd. to prompt or influence you in making an investment decision to purchase, sell, hold or exchange any security or to influence the timing of such activity. This content is produced by Fortrade Limited which is not registered in any capacity with any securities regulatory authority in Canada.
71% of retail investor accounts lose money when trading CFDs with this provider.
CFDs are complex instruments and come with a high risk of losing money rapidly due to leverage. 71% of retail investor accounts lose money when trading CFDs with this provider. You should consider whether you understand how CFDs work and whether you can afford to take the high risk of losing your money.
70.91% of retail investor accounts lose money when trading CFDs with this provider.
CFDs are complex instruments and come with a high risk of losing money rapidly due to leverage. 70.91% of retail investor accounts lose money when trading CFDs with this provider. You should consider whether you understand how CFDs work and whether you can afford to take the high risk of losing all your money. Read full risk warning.
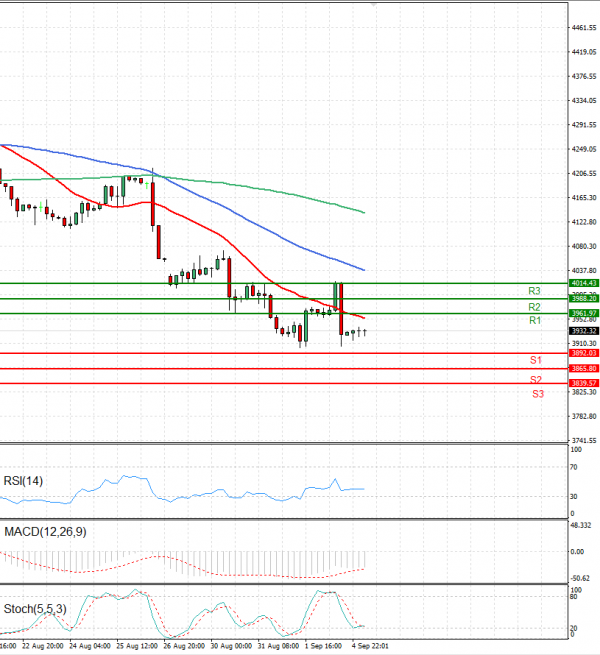
EU Session Analysis for CFD Instruments 05/09/2022
Fundamental analysis
05 September, 2022
USA 500 was 0.07% up during Asian session trading currently around 3927.5. U.S stocks closed mainly in red on Friday, as early gains from a jobs report that showed a labour market that may be starting to loosen gave way to worries about the European gas crisis. Initial gains were erased after Gazprom said it could not safely restart deliveries until it had fixed an oil leak found in a vital turbine and did not give a new time frame. Today is Labour day in the US and the US stock market will be closed.