Fortrade Canada Ltd. as an order-execution only dealer is not permitted to provide you with any advice or recommendations. These Market Commentaries should not be construed as a recommendation, advice or any attempt by Fortrade Canada Ltd. to prompt or influence you in making an investment decision to purchase, sell, hold or exchange any security or to influence the timing of such activity. This content is produced by Fortrade Limited which is not registered in any capacity with any securities regulatory authority in Canada.
69% of retail investor accounts lose money when trading CFDs with this provider.
CFDs are complex instruments and come with a high risk of losing money rapidly due to leverage. 69% of retail investor accounts lose money when trading CFDs with this provider. You should consider whether you understand how CFDs work and whether you can afford to take the high risk of losing your money.
67.52% of retail investor accounts lose money when trading CFDs with this provider.
CFDs are complex instruments and come with a high risk of losing money rapidly due to leverage. 67.52% of retail investor accounts lose money when trading CFDs with this provider. You should consider whether you understand how CFDs work and whether you can afford to take the high risk of losing all your money. Read full risk warning.
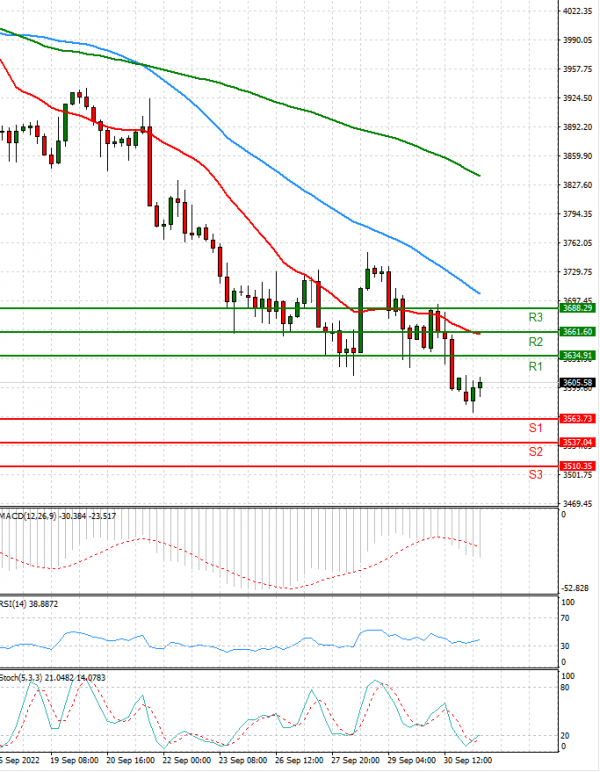
EU Session Analysis for CFD Instruments 03/10/2022
Fundamental analysis
03 October, 2022
The S&P 500 closed the books on its steepest September decline in two decades on Friday, skidding across the finish line of a tumultuous quarter fraught with historically hot inflation, rising interest rates and recession fears. All three major indexes veered to a sharply lower end, having quashed a brief rally early in the session. The Federal Reserve has rattled markets by engaging in its most relentless series of interest rate hikes in decades in order to rein in stubbornly high inflation, which has many market participants eyeing key economic data for signs of a looming recession. Corporate earnings reports for the quarter that ends with Friday's closing bell will begin landing in a few weeks, and analyst expectations are trending downward.