Fortrade Canada Ltd. as an order-execution only dealer is not permitted to provide you with any advice or recommendations. These Market Commentaries should not be construed as a recommendation, advice or any attempt by Fortrade Canada Ltd. to prompt or influence you in making an investment decision to purchase, sell, hold or exchange any security or to influence the timing of such activity. This content is produced by Fortrade Limited which is not registered in any capacity with any securities regulatory authority in Canada.
71% of retail investor accounts lose money when trading CFDs with this provider.
CFDs are complex instruments and come with a high risk of losing money rapidly due to leverage. 71% of retail investor accounts lose money when trading CFDs with this provider. You should consider whether you understand how CFDs work and whether you can afford to take the high risk of losing your money.
70.41% of retail investor accounts lose money when trading CFDs with this provider.
CFDs are complex instruments and come with a high risk of losing money rapidly due to leverage. 70.41% of retail investor accounts lose money when trading CFDs with this provider. You should consider whether you understand how CFDs work and whether you can afford to take the high risk of losing all your money. Read full risk warning.
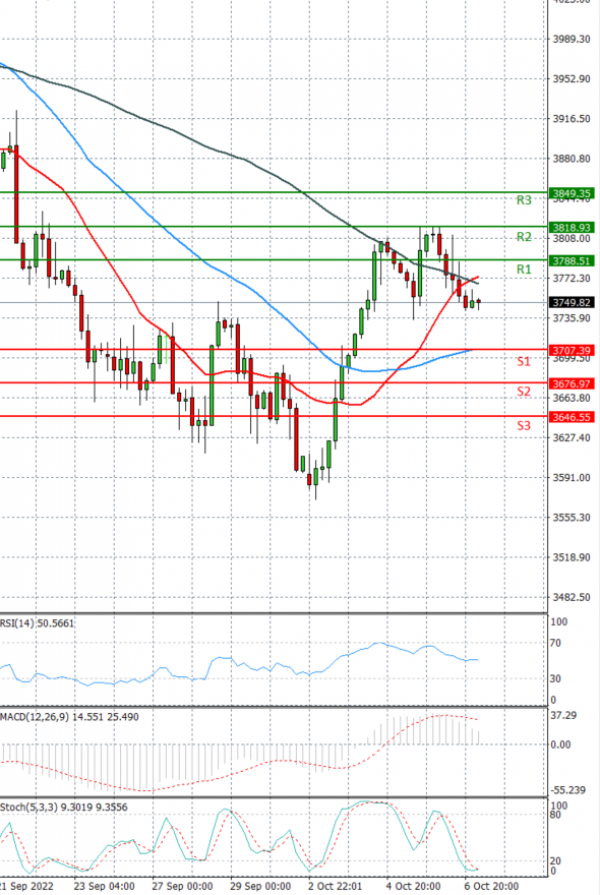
EU Session Analysis for CFD Instruments 07/10/2022
Fundamental analysis
07 October, 2022
Wall Street's major indexes closed lower on Thursday as concerns mounted ahead of closely watched monthly nonfarm payrolls numbers due on Friday that the Federal Reserve's aggressive interest rate stance will lead to a recession. Markets briefly took comfort from data that showed weekly jobless claims rose by the most in four months last week, raising a glimmer of hope the Fed could ease the implementation since March of the fastest and highest jump in rates in decades. Chicago Fed President Charles Evans was the latest to spell out the central bank's outlook on Thursday, saying policymakers expect to deliver 125 basis points of rate hikes before year's end as inflation readings have been disappointing. Money markets are pricing in an almost 86% chance of a fourth straight 75 basis-point rate hike when policymakers meet on Nov. 1-2.