Fortrade Canada Ltd. as an order-execution only dealer is not permitted to provide you with any advice or recommendations. These Market Commentaries should not be construed as a recommendation, advice or any attempt by Fortrade Canada Ltd. to prompt or influence you in making an investment decision to purchase, sell, hold or exchange any security or to influence the timing of such activity. This content is produced by Fortrade Limited which is not registered in any capacity with any securities regulatory authority in Canada.
69% of retail investor accounts lose money when trading CFDs with this provider.
CFDs are complex instruments and come with a high risk of losing money rapidly due to leverage. 69% of retail investor accounts lose money when trading CFDs with this provider. You should consider whether you understand how CFDs work and whether you can afford to take the high risk of losing your money.
70.88% of retail investor accounts lose money when trading CFDs with this provider.
CFDs are complex instruments and come with a high risk of losing money rapidly due to leverage. 70.88% of retail investor accounts lose money when trading CFDs with this provider. You should consider whether you understand how CFDs work and whether you can afford to take the high risk of losing all your money. Read full risk warning.
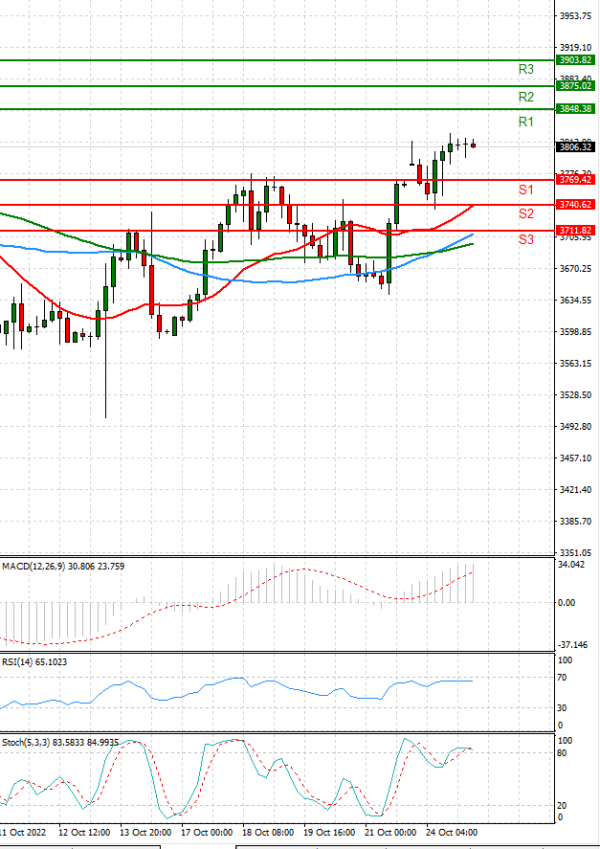
EU Session Analysis for CFD Instruments 25/10/2022
Fundamental analysis
25 October, 2022
U.S. stocks closed higher on Monday, extending last week's advances as signs of economic softness suggested the effects of the Fed's aggressive policy aimed at cooling the economy, thereby curbing decades-high inflation, are beginning to take root. All three major U.S. stock indexes gained momentum throughout the first session of a week jam-packed with high profile corporate earnings and crucial economic data. U.S.-listed shares of Chinese companies such as Baidu and Nio plunged as President Xi Jinping introduced the new Politburo Standing Committee stacked with loyalists though to support regulation.