Fortrade Canada Ltd. as an order-execution only dealer is not permitted to provide you with any advice or recommendations. These Market Commentaries should not be construed as a recommendation, advice or any attempt by Fortrade Canada Ltd. to prompt or influence you in making an investment decision to purchase, sell, hold or exchange any security or to influence the timing of such activity. This content is produced by Fortrade Limited which is not registered in any capacity with any securities regulatory authority in Canada.
70% of retail investor accounts lose money when trading CFDs with this provider.
CFDs are complex instruments and come with a high risk of losing money rapidly due to leverage. 70% of retail investor accounts lose money when trading CFDs with this provider. You should consider whether you understand how CFDs work and whether you can afford to take the high risk of losing your money.
70.41% of retail investor accounts lose money when trading CFDs with this provider.
CFDs are complex instruments and come with a high risk of losing money rapidly due to leverage. 70.41% of retail investor accounts lose money when trading CFDs with this provider. You should consider whether you understand how CFDs work and whether you can afford to take the high risk of losing all your money. Read full risk warning.
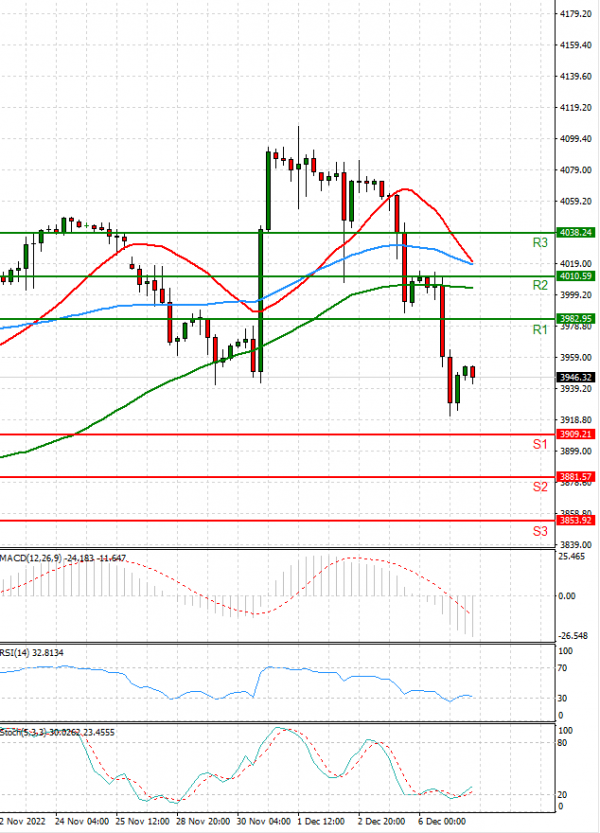
EU Session Analysis for CFD Instruments 07/12/2022
Fundamental analysis
07 December, 2022
Wall Street closed lower on Tuesday, with the S&P 500 declining for the fourth straight session, as skittish investors fretted over Federal Reserve rate hikes and further talk of a looming recession. Future economic growth prospects were in focus on Tuesday following comments from financial titans pointing toward uncertain times ahead. Bank of America Corp's chief executive predicted three quarters of mild negative growth next year, while JPMorgan Chase and Co's CEO Jamie Dimon said inflation will erode consumer spending power and that a mild to more pronounced recession was likely ahead.