Fortrade Canada Ltd. as an order-execution only dealer is not permitted to provide you with any advice or recommendations. These Market Commentaries should not be construed as a recommendation, advice or any attempt by Fortrade Canada Ltd. to prompt or influence you in making an investment decision to purchase, sell, hold or exchange any security or to influence the timing of such activity. This content is produced by Fortrade Limited which is not registered in any capacity with any securities regulatory authority in Canada.
71% of retail investor accounts lose money when trading CFDs with this provider.
CFDs are complex instruments and come with a high risk of losing money rapidly due to leverage. 71% of retail investor accounts lose money when trading CFDs with this provider. You should consider whether you understand how CFDs work and whether you can afford to take the high risk of losing your money.
70.41% of retail investor accounts lose money when trading CFDs with this provider.
CFDs are complex instruments and come with a high risk of losing money rapidly due to leverage. 70.41% of retail investor accounts lose money when trading CFDs with this provider. You should consider whether you understand how CFDs work and whether you can afford to take the high risk of losing all your money. Read full risk warning.
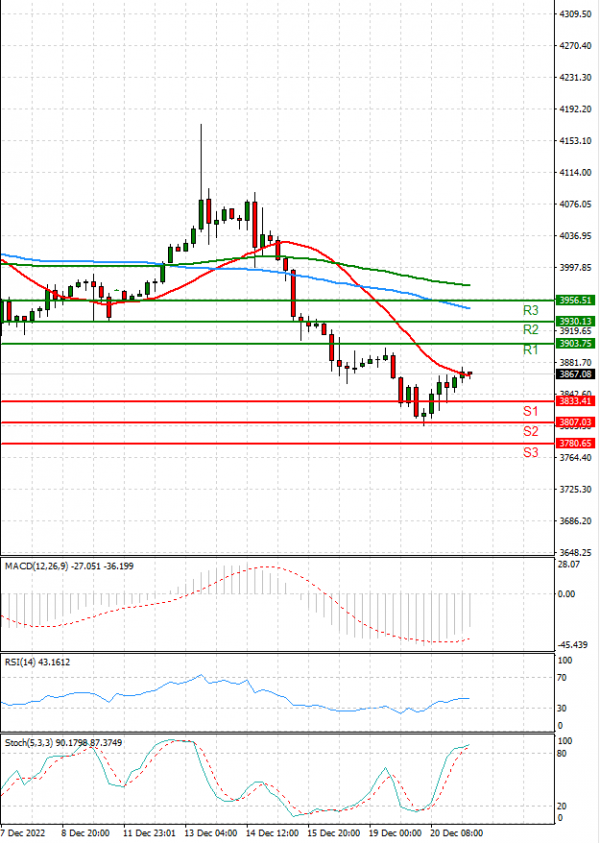
EU Session Analysis for CFD Instruments 21/12/2022
Fundamental analysis
21 December, 2022
The S&P 500 closed slightly higher on Tuesday after four sessions of declines, but investors fretted about weak holiday shopping and rising bond yields added pressure after the Bank of Japan's (BoJ) surprise tweak of its monetary policy. Fears about the economic impact of the Federal Reserve's plan to keep raising U.S. interest rates have weighed heavily on equities since its policy meeting last week. Tesla Inc shares tumbled after at least three brokerages cut the electric vehicle maker's target price on growing concerns of demand weakness and risk from Chief Executive Elon Musk's Twitter distraction.