Fortrade Canada Ltd. as an order-execution only dealer is not permitted to provide you with any advice or recommendations. These Market Commentaries should not be construed as a recommendation, advice or any attempt by Fortrade Canada Ltd. to prompt or influence you in making an investment decision to purchase, sell, hold or exchange any security or to influence the timing of such activity. This content is produced by Fortrade Limited which is not registered in any capacity with any securities regulatory authority in Canada.
71% of retail investor accounts lose money when trading CFDs with this provider.
CFDs are complex instruments and come with a high risk of losing money rapidly due to leverage. 71% of retail investor accounts lose money when trading CFDs with this provider. You should consider whether you understand how CFDs work and whether you can afford to take the high risk of losing your money.
70.41% of retail investor accounts lose money when trading CFDs with this provider.
CFDs are complex instruments and come with a high risk of losing money rapidly due to leverage. 70.41% of retail investor accounts lose money when trading CFDs with this provider. You should consider whether you understand how CFDs work and whether you can afford to take the high risk of losing all your money. Read full risk warning.
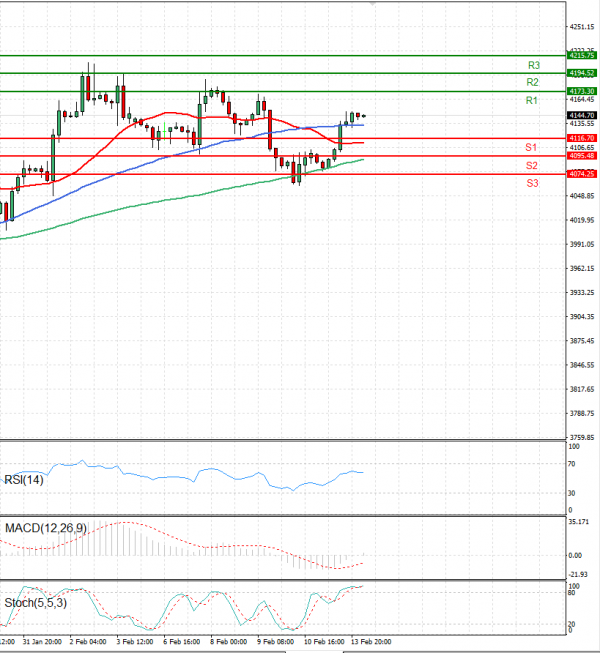
EU Session Analysis for CFD Instruments 14/02/2023
Fundamental analysis
14 February, 2023
Wall Street closed higher on Monday as investors awaited inflation data likely to hint at the path of the Federal Reserve's future interest rate hikes, while Meta Platforms gained after a report that the Facebook parent was planning fresh layoffs. Meta jumped after the Financial Times reported on Sunday that the company was preparing to announce a new round of job cuts, adding to layoffs last November. Helping lift Microsoft, Stifel raised its price target on the software company and said it is clearly looking to upend Alphabet's Google search dominance through its integration with ChatGPT. Investors are laser-focused on January inflation data due on Tuesday to reassess their bets on the central bank's monetary policy path.