Fortrade Canada Ltd. as an order-execution only dealer is not permitted to provide you with any advice or recommendations. These Market Commentaries should not be construed as a recommendation, advice or any attempt by Fortrade Canada Ltd. to prompt or influence you in making an investment decision to purchase, sell, hold or exchange any security or to influence the timing of such activity. This content is produced by Fortrade Limited which is not registered in any capacity with any securities regulatory authority in Canada.
69% of retail investor accounts lose money when trading CFDs with this provider.
CFDs are complex instruments and come with a high risk of losing money rapidly due to leverage. 69% of retail investor accounts lose money when trading CFDs with this provider. You should consider whether you understand how CFDs work and whether you can afford to take the high risk of losing your money.
67.52% of retail investor accounts lose money when trading CFDs with this provider.
CFDs are complex instruments and come with a high risk of losing money rapidly due to leverage. 67.52% of retail investor accounts lose money when trading CFDs with this provider. You should consider whether you understand how CFDs work and whether you can afford to take the high risk of losing all your money. Read full risk warning.
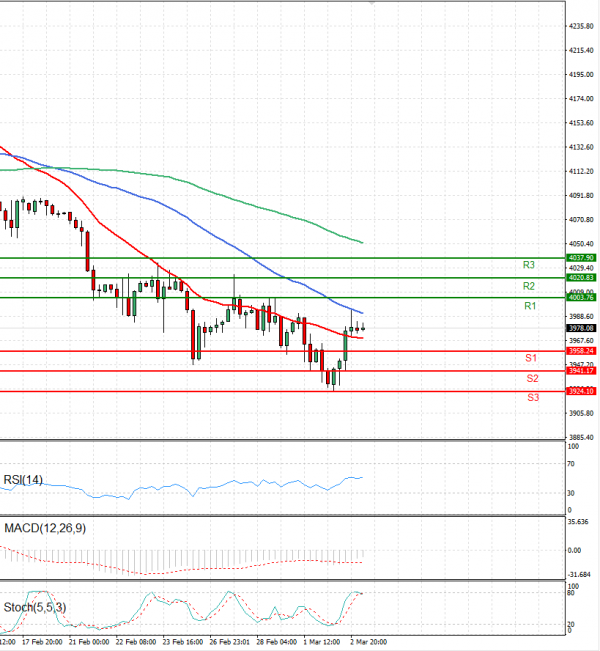
EU Session Analysis for CFD Instruments 03/03/2023
Fundamental analysis
03 March, 2023
U.S. stocks rallied on Thursday, as Treasury yields pulled back from earlier highs following comments from Atlanta Federal Reserve President Raphael Bostic about his favored path of interest rate hikes for the central bank. In an argument for quarter-point hikes, Bostic said he favored "slow and steady" as the appropriate course of action for the Fed, as the impact of higher interest rates may only start to be felt in the spring. Tesla Inc fell after Chief Executive Elon Musk and team's four-hour presentation failed to impress investors with few details on its plan to unveil an affordable electric vehicle.