Fortrade Canada Ltd. as an order-execution only dealer is not permitted to provide you with any advice or recommendations. These Market Commentaries should not be construed as a recommendation, advice or any attempt by Fortrade Canada Ltd. to prompt or influence you in making an investment decision to purchase, sell, hold or exchange any security or to influence the timing of such activity. This content is produced by Fortrade Limited which is not registered in any capacity with any securities regulatory authority in Canada.
69% of retail investor accounts lose money when trading CFDs with this provider.
CFDs are complex instruments and come with a high risk of losing money rapidly due to leverage. 69% of retail investor accounts lose money when trading CFDs with this provider. You should consider whether you understand how CFDs work and whether you can afford to take the high risk of losing your money.
67.52% of retail investor accounts lose money when trading CFDs with this provider.
CFDs are complex instruments and come with a high risk of losing money rapidly due to leverage. 67.52% of retail investor accounts lose money when trading CFDs with this provider. You should consider whether you understand how CFDs work and whether you can afford to take the high risk of losing all your money. Read full risk warning.
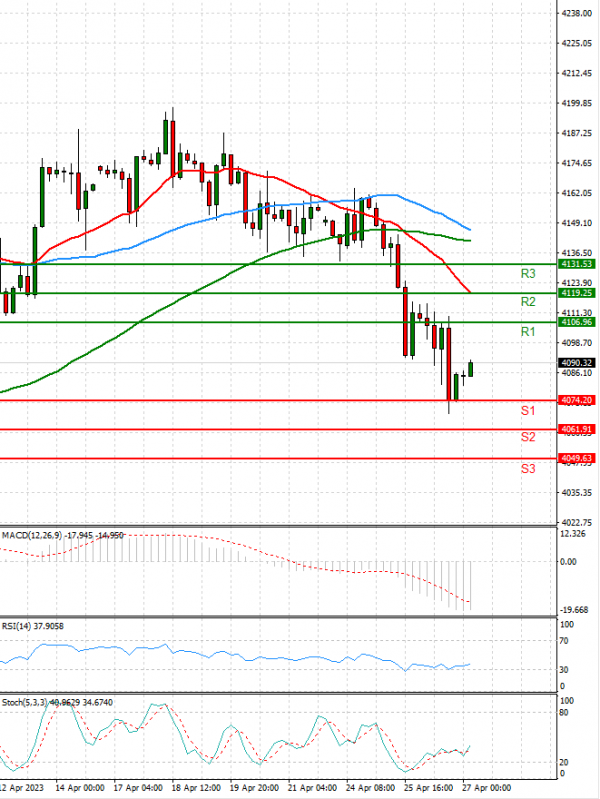
EU Session Analysis for CFD Instruments 27/04/2023
Fundamental analysis
27 April, 2023
The S&P 500 and the Dow ended lower, dragged down by economically sensitive transport stocks due to ongoing recession fears. Bank stocks were also under pressure as regional bank First Republic hit a record low. Investors have been jittery about the sector since the recent failure of two U.S. banks. The tech-heavy Nasdaq outperformed Wall Street's other major indexes on Wednesday after strong Microsoft Corp results boosted the technology sector but gains pared as the session wore on due to lingering concerns about a weakening U.S. economy and the banking sector.