Fortrade Canada Ltd. as an order-execution only dealer is not permitted to provide you with any advice or recommendations. These Market Commentaries should not be construed as a recommendation, advice or any attempt by Fortrade Canada Ltd. to prompt or influence you in making an investment decision to purchase, sell, hold or exchange any security or to influence the timing of such activity. This content is produced by Fortrade Limited which is not registered in any capacity with any securities regulatory authority in Canada.
69% of retail investor accounts lose money when trading CFDs with this provider.
CFDs are complex instruments and come with a high risk of losing money rapidly due to leverage. 69% of retail investor accounts lose money when trading CFDs with this provider. You should consider whether you understand how CFDs work and whether you can afford to take the high risk of losing your money.
70.88% of retail investor accounts lose money when trading CFDs with this provider.
CFDs are complex instruments and come with a high risk of losing money rapidly due to leverage. 70.88% of retail investor accounts lose money when trading CFDs with this provider. You should consider whether you understand how CFDs work and whether you can afford to take the high risk of losing all your money. Read full risk warning.
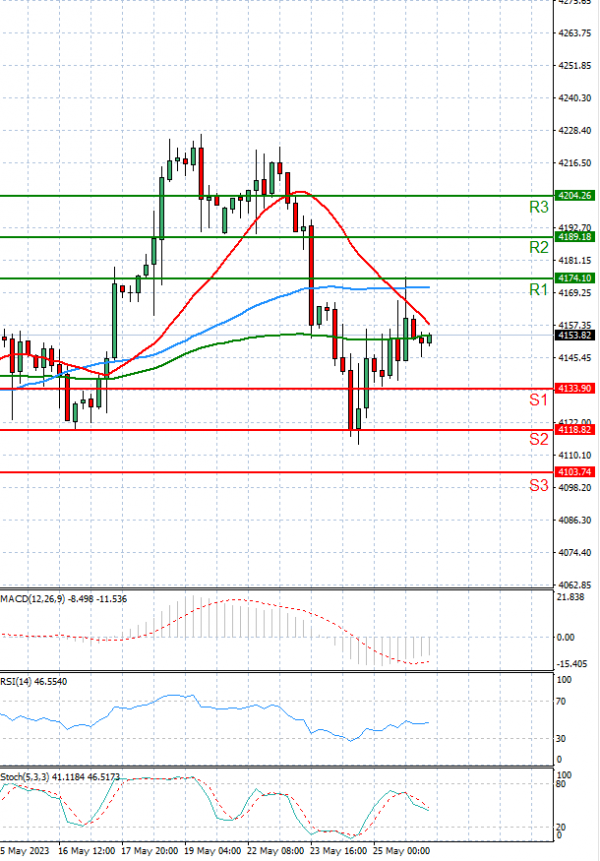
EU Session Analysis for CFD Instruments 26/05/2023
Fundamental analysis
26 May, 2023
Wall Street ended sharply higher on Thursday after a blowout forecast from Nvidia sent the chipmaker's stock soaring and fueled a rally in AI-related companies, while investors watched for signs of progress in U.S. debt ceiling talks. Nvidia Corp soared 24% to a record high close after the world's most valuable chipmaker forecast quarterly revenue 50% higher than estimates and said it was ramping up supply to meet demand for its artificial-intelligence (AI) chips. Investors exchanged almost $60 billion worth of Nvidia's shares, accounting for a fifth of all trading in S&P 500 stocks during the session, according to Refintiv data.