Fortrade Canada Ltd. as an order-execution only dealer is not permitted to provide you with any advice or recommendations. These Market Commentaries should not be construed as a recommendation, advice or any attempt by Fortrade Canada Ltd. to prompt or influence you in making an investment decision to purchase, sell, hold or exchange any security or to influence the timing of such activity. This content is produced by Fortrade Limited which is not registered in any capacity with any securities regulatory authority in Canada.
69% of retail investor accounts lose money when trading CFDs with this provider.
CFDs are complex instruments and come with a high risk of losing money rapidly due to leverage. 69% of retail investor accounts lose money when trading CFDs with this provider. You should consider whether you understand how CFDs work and whether you can afford to take the high risk of losing your money.
67.52% of retail investor accounts lose money when trading CFDs with this provider.
CFDs are complex instruments and come with a high risk of losing money rapidly due to leverage. 67.52% of retail investor accounts lose money when trading CFDs with this provider. You should consider whether you understand how CFDs work and whether you can afford to take the high risk of losing all your money. Read full risk warning.
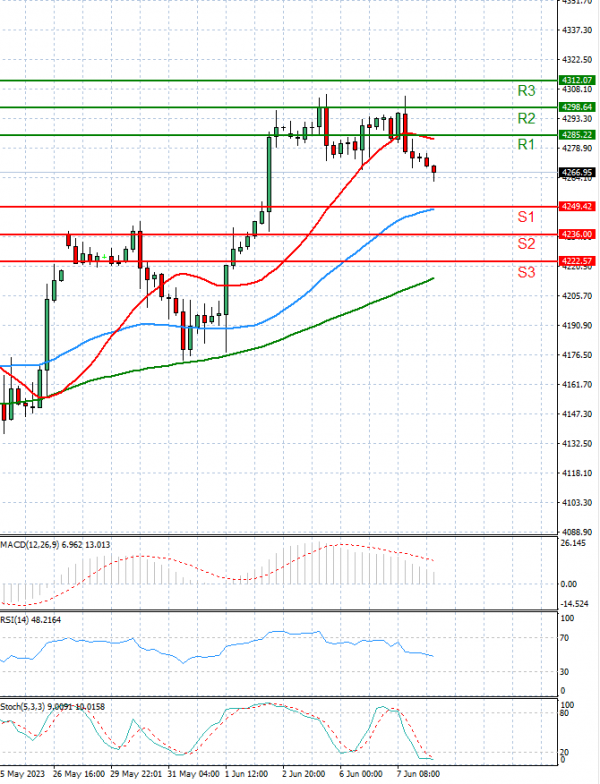
EU Session Analysis for CFD Instruments 08/06/2023
Fundamental analysis
08 June, 2023
The S&P 500 and Nasdaq closed in negative territory on Wednesday as investors took profits after a months-long megacap stocks run and ahead of key economic and policy events next week. U.S. inflation data is expected to show consumer prices eased slightly in May from the previous month but with elevated core prices. Weighing on stocks, the two-year U.S. Treasury yield and benchmark 10-year yield increased after the Bank of Canada raised interest rates, adding to investor jitters about the Federal Reserve's next U.S. interest rate decision. Coinbase shares advanced 3.20% the day after they hit a seven-month low, as the company's CEO reassured customers that their funds were safe and blasted the U.S. Securities and Exchange Commission over its lawsuit. On Tuesday, the SEC sued the largest U.S. crypto exchange, accusing it of operating illegally, without having first registered with regulator. Cathie Wood's Ark Invest bought 419,324 shares of Coinbase on Tuesday.