Fortrade Canada Ltd. as an order-execution only dealer is not permitted to provide you with any advice or recommendations. These Market Commentaries should not be construed as a recommendation, advice or any attempt by Fortrade Canada Ltd. to prompt or influence you in making an investment decision to purchase, sell, hold or exchange any security or to influence the timing of such activity. This content is produced by Fortrade Limited which is not registered in any capacity with any securities regulatory authority in Canada.
71% of retail investor accounts lose money when trading CFDs with this provider.
CFDs are complex instruments and come with a high risk of losing money rapidly due to leverage. 71% of retail investor accounts lose money when trading CFDs with this provider. You should consider whether you understand how CFDs work and whether you can afford to take the high risk of losing your money.
70.91% of retail investor accounts lose money when trading CFDs with this provider.
CFDs are complex instruments and come with a high risk of losing money rapidly due to leverage. 70.91% of retail investor accounts lose money when trading CFDs with this provider. You should consider whether you understand how CFDs work and whether you can afford to take the high risk of losing all your money. Read full risk warning.
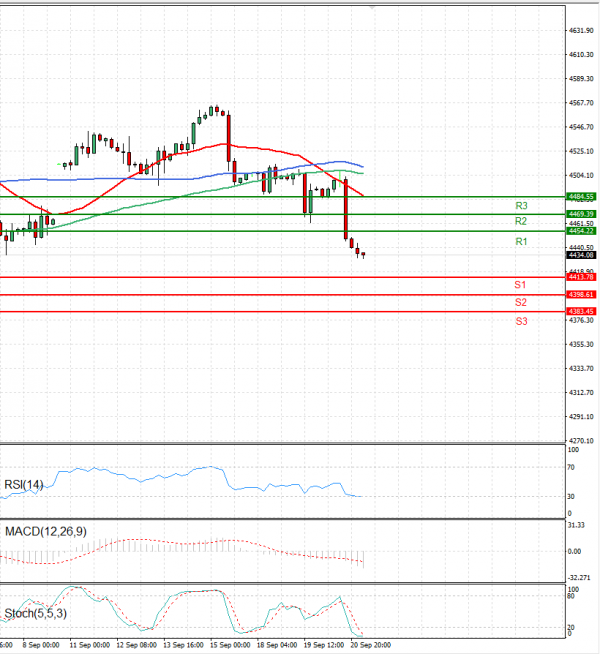
EU Session Analysis for CFD Instruments 21/09/2023
Fundamental analysis
21 September, 2023
U.S. stocks slumped on Wednesday after the U.S. Federal Reserve held key interest rates unchanged as widely expected, and revised economic projections higher with warnings that the battle against inflation was far from over. All three major U.S. stock indexes retreated in the wake of the announcement, with interest rate sensitive megacap stocks Microsoft Corp, Apple Inc and Nvidia Corp pulling the Nasdaq down most. The Fed's announcement was accompanied by its Summary Economic Projections (SEP) and dot plot, which sees an additional 25 basis point rate hike this year, peaking in the 5.50%-5.75% range. The SEP projections also called for 50 basis points of rate cuts next year. At the subsequent press conference, Fed Chairman Jerome Powell tempered rosier economic projections with a warning that inflation has a long way to go before reaching that target.