Fortrade Canada Ltd. as an order-execution only dealer is not permitted to provide you with any advice or recommendations. These Market Commentaries should not be construed as a recommendation, advice or any attempt by Fortrade Canada Ltd. to prompt or influence you in making an investment decision to purchase, sell, hold or exchange any security or to influence the timing of such activity. This content is produced by Fortrade Limited which is not registered in any capacity with any securities regulatory authority in Canada.
69% of retail investor accounts lose money when trading CFDs with this provider.
CFDs are complex instruments and come with a high risk of losing money rapidly due to leverage. 69% of retail investor accounts lose money when trading CFDs with this provider. You should consider whether you understand how CFDs work and whether you can afford to take the high risk of losing your money.
67.52% of retail investor accounts lose money when trading CFDs with this provider.
CFDs are complex instruments and come with a high risk of losing money rapidly due to leverage. 67.52% of retail investor accounts lose money when trading CFDs with this provider. You should consider whether you understand how CFDs work and whether you can afford to take the high risk of losing all your money. Read full risk warning.
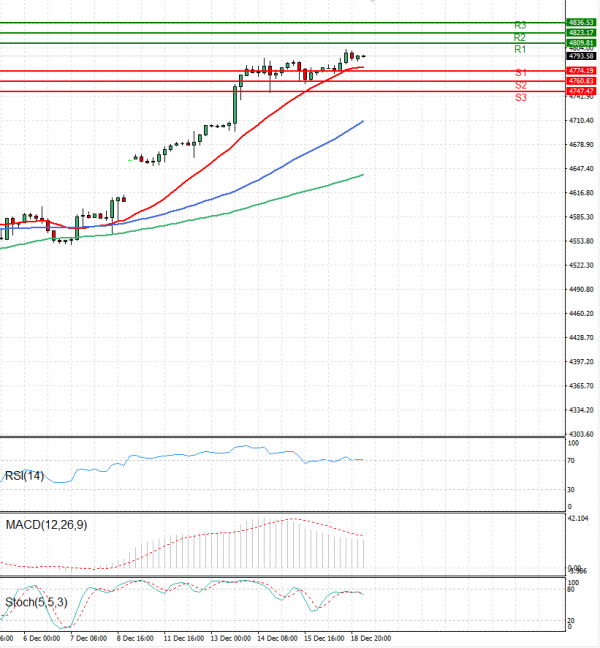
EU Session Analysis for CFD Instruments 19/12/2023
Fundamental analysis
19 December, 2023
The USA500 is trading at 4,740.
US stocks edged higher Monday, building on a seven-week climb even as Federal Reserve officials tried to rein in high expectations for interest rate cuts.
The Dow Jones Industrial Average was virtually unchanged, as the index just barely notched another record close. The benchmark S&P 500 gained nearly 0.5%, while the tech-heavy Nasdaq Composite advanced about 0.6%.
Stocks have surged as investors became increasingly convinced the Federal Reserve would make more rate cuts in 2024 than previously forecast. Those hopes got a boost last week, as policymakers recognized its efforts to cool inflation were having an impact.